| View previous topic :: View next topic |
| Author |
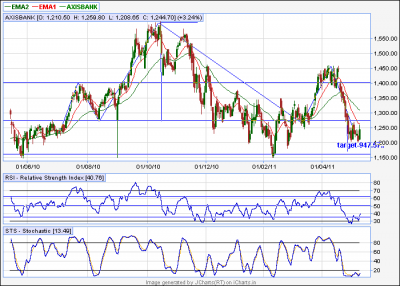
head and shoulder pattern for AXISBANK.. |
rrk2006hyd
Yellow Belt

Joined: 13 Oct 2010
Posts: 874
|
Post: #1  Posted: Sat May 14, 2011 11:20 am Post subject: head and shoulder pattern for AXISBANK.. Posted: Sat May 14, 2011 11:20 am Post subject: head and shoulder pattern for AXISBANK.. |
 |
|
this is found in AXIBANK..so is it coming down to 947.57?
| Description: |
|
| Filesize: |
21.16 KB |
| Viewed: |
633 Time(s) |
|
|
|
| Back to top |
|
 |
|
| |
grizzlybull
White Belt

Joined: 26 Sep 2010
Posts: 80
|
| Post: #2 Posted: Sat May 14, 2011 3:39 pm Post subject: |
|
|
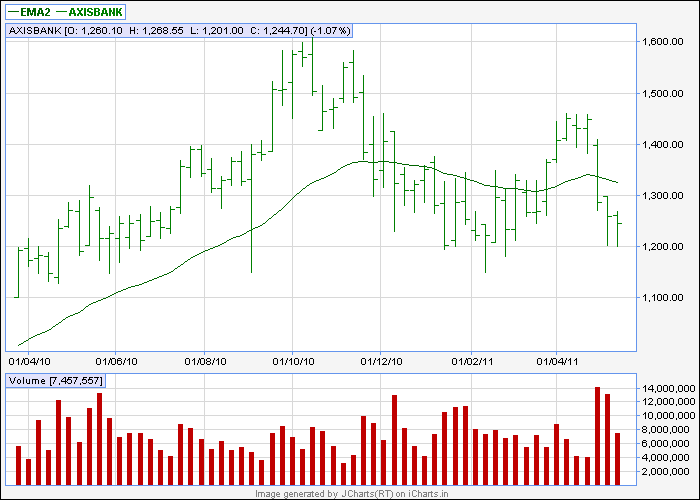
don't use daily charts, use weekly or monthly charts to determine the long term trend.
see the chart below? where is the head and shoulders? Don't let the day to day movements give you wrong indications. the stock still looks like it's making a major top.
| Description: |
|
| Filesize: |
10.08 KB |
| Viewed: |
1507 Time(s) |
|
|
|
| Back to top |
|
|
rrk2006hyd
Yellow Belt
Joined: 13 Oct 2010
Posts: 874
|
| Post: #3 Posted: Sat May 14, 2011 5:08 pm Post subject: |
|
|
thank you grizzlybull...
| grizzlybull wrote: | don't use daily charts, use weekly or monthly charts to determine the long term trend.
see the chart below? where is the head and shoulders? Don't let the day to day movements give you wrong indications. the stock still looks like it's making a major top. |
|
|
| Back to top |
|
|
grizzlybull
White Belt
Joined: 26 Sep 2010
Posts: 80
|
| Post: #4 Posted: Sat May 14, 2011 6:34 pm Post subject: |
|
|
| rrk2006hyd wrote: | thank you grizzlybull...
| grizzlybull wrote: | don't use daily charts, use weekly or monthly charts to determine the long term trend.
see the chart below? where is the head and shoulders? Don't let the day to day movements give you wrong indications. the stock still looks like it's making a major top. |
|
actually, the head and shoulders formation you saw would work beautifully in a shorter 5 to 30 minute interval, instead of daily. hereby the time you got past the neckline you would have got a very small profit.
btw, axis bank might be making a top as I said before, but that does not rule out a continuation once the last high is broken. 
|
|
| Back to top |
|
|
|
|
You cannot post new topics in this forum
You cannot reply to topics in this forum
You cannot edit your posts in this forum
You cannot delete your posts in this forum
You cannot vote in polls in this forum
You can attach files in this forum
You can download files in this forum
|
Powered by phpBB © 2001, 2005 phpBB Group
|
|


