| View previous topic :: View next topic |
| Author |
holy grail |
sathya999
White Belt

Joined: 08 Apr 2008
Posts: 35
|
Post: #1  Posted: Sat May 28, 2011 3:12 pm Post subject: holy grail Posted: Sat May 28, 2011 3:12 pm Post subject: holy grail |
 |
|
holy grail 
was reading this on another blog.
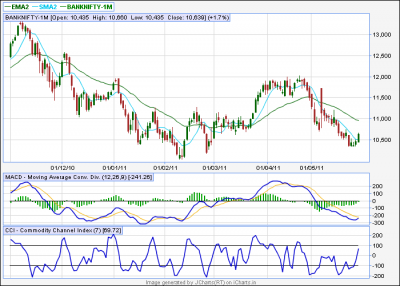
The holy grail is not traingle breakout, head and shoulders etc.. but it is the first pullback.
Hmm so lets take an intra timeframe, a daily timeframe, 2/3 stocks/indices and see how they develop over period of time.
Rules
Pullback defined by CCI(3) (ST idea) oversold in uptrend, overbought in downtrend. I have seen RSI(2) also being used for defining oversold/overbought. Or CCI(7) for daily CCI(3) for intra
Pullback is taken when price is still above/below our reference ema. For example uptrend pullback should stop above 34 ema.
Once you get pullback, wait for a candle close beyond the oversold/overbought candle.
SL will be overbought/oversold candle close as appropriate according to the uptrend/downtrend.
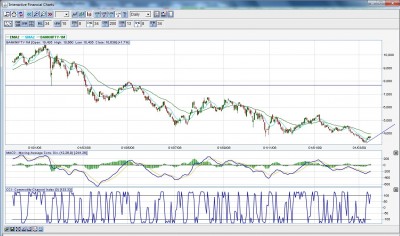
I am curios to see possible interpretations of this chart..... i.e. ur views on this chart.Keeping in mind the above narrative.
| Description: |
|
| Filesize: |
33.02 KB |
| Viewed: |
485 Time(s) |

|
| Description: |
|
| Filesize: |
282.73 KB |
| Viewed: |
456 Time(s) |

|
|
|
| Back to top |
|
 |
|
|  |
radheradhe
White Belt

Joined: 01 Jan 2011
Posts: 3
|
Post: #2  Posted: Sun May 29, 2011 9:18 am Post subject: Posted: Sun May 29, 2011 9:18 am Post subject: |
 |
|
 gajab kya modified kiya system ko lago raho bhai...kewl gajab kya modified kiya system ko lago raho bhai...kewl 
|
|
| Back to top |
|
 |
sathya999
White Belt

Joined: 08 Apr 2008
Posts: 35
|
Post: #3  Posted: Wed Jun 01, 2011 9:08 pm Post subject: tmow Posted: Wed Jun 01, 2011 9:08 pm Post subject: tmow |
 |
|
Tomorow we could get Red close below 34 ema. So we can enter short according to this stratergy. (I have pasted the chart) 
TSL then will be close in green above 34 ema.
|
|
| Back to top |
|
 |
sherbaaz
Yellow Belt

Joined: 27 May 2009
Posts: 543
|
Post: #4  Posted: Wed Jun 01, 2011 10:08 pm Post subject: Posted: Wed Jun 01, 2011 10:08 pm Post subject: |
 |
|
Hi Sathya,
For pullback u can use 3 ll or 2ll+id(in an uptrend and vice versa) also in and uptrend and trend can be defined in 2 ways one by slope of 20 ema (or any other) or with the help of +dmi and -dmi.
also if u put adx>=30 during a pullback, will give u good results. as then the strength of the trend would be very strong.
Regards,
|
|
| Back to top |
|
 |
|
|
You cannot post new topics in this forum
You cannot reply to topics in this forum
You cannot edit your posts in this forum
You cannot delete your posts in this forum
You cannot vote in polls in this forum
You can attach files in this forum
You can download files in this forum
|
Powered by phpBB © 2001, 2005 phpBB Group
|
|

