| View previous topic :: View next topic |
| Author |
hour chart trendline |
seshareddy
White Belt

Joined: 06 Jan 2009
Posts: 95
|
Post: #1  Posted: Wed Dec 29, 2010 9:55 pm Post subject: hour chart trendline Posted: Wed Dec 29, 2010 9:55 pm Post subject: hour chart trendline |
 |
|
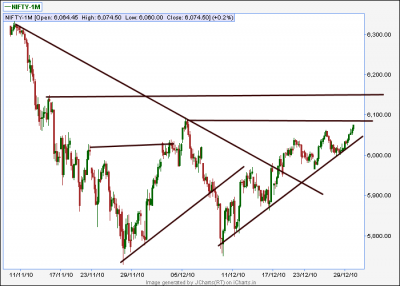
hi all
enjoy with hour chart trendline
seshareddy
| Description: |
|
| Filesize: |
18.14 KB |
| Viewed: |
387 Time(s) |

|
|
|
| Back to top |
|
 |
|
|  |
hbanerji
White Belt

Joined: 16 Apr 2009
Posts: 31
|
Post: #2  Posted: Wed Dec 29, 2010 11:18 pm Post subject: Posted: Wed Dec 29, 2010 11:18 pm Post subject: |
 |
|
sesha ji, yes, this is in the right direction.
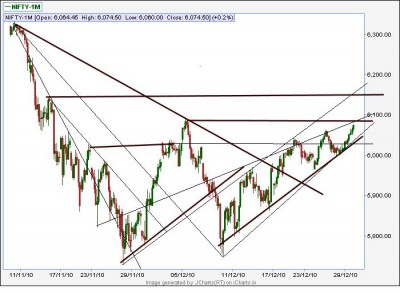
a small suggestion, if i may... we draw new trendlines whenever there's a higher low or a lower high. these are not primary trends unless they override the major ongoing trends. but they give us an insight into the process of corrections and reversing.
i have used ur chart to mark secondary trends. you can study the crossovers and their effects.
also, you may use these trendlines to devise a trading strategy. in my setup, i will short the first red candle at or above the trendline indicating resistance, unless an immediately prior higher low was seen. sl remains to be calculated. a fair measure will be to use a fib calc as provided by icharts. the reverse may be the approach for the support trendline[/img]
| Description: |
|
| Filesize: |
60.22 KB |
| Viewed: |
412 Time(s) |

|
|
|
| Back to top |
|
 |
seshareddy
White Belt

Joined: 06 Jan 2009
Posts: 95
|
Post: #3  Posted: Thu Dec 30, 2010 2:14 am Post subject: Posted: Thu Dec 30, 2010 2:14 am Post subject: |
 |
|
HI hbanerji
excellent your secondary lines
yes we can short at long length trendline wall
i will short when candlestick reversal pattern happens generally
for example when mkt reached 6062 next candle is bearish engluf
seshareddy
|
|
| Back to top |
|
 |
seshareddy
White Belt

Joined: 06 Jan 2009
Posts: 95
|
Post: #4  Posted: Thu Dec 30, 2010 6:06 pm Post subject: Posted: Thu Dec 30, 2010 6:06 pm Post subject: |
 |
|
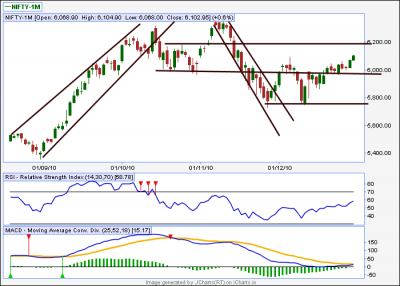
daily chart enclosed
seshareddy
| Description: |
|
| Filesize: |
24.82 KB |
| Viewed: |
400 Time(s) |

|
|
|
| Back to top |
|
 |
|
|
You cannot post new topics in this forum
You cannot reply to topics in this forum
You cannot edit your posts in this forum
You cannot delete your posts in this forum
You cannot vote in polls in this forum
You can attach files in this forum
You can download files in this forum
|
Powered by phpBB © 2001, 2005 phpBB Group
|
|

