| View previous topic :: View next topic |
| From which Method early trend change should get found |
| Moving Averages |
|
16% |
[ 31 ] |
| Indicators |
|
11% |
[ 22 ] |
| Candelstics |
|
33% |
[ 63 ] |
| Mov Avg with Indicators |
|
21% |
[ 40 ] |
| Breakout Trading |
|
17% |
[ 34 ] |
|
| Total Votes : 190 |
|
| Author |
How to catch early TREND REVERSAL |
AMBY
Yellow Belt

Joined: 05 Sep 2014
Posts: 503
|
Post: #106  Posted: Wed Apr 08, 2015 5:13 pm Post subject: Posted: Wed Apr 08, 2015 5:13 pm Post subject: |
 |
|
| THANKS FOR POSTING ADX/DMI.
|
|
| Back to top |
|
 |
|
|
 |
systrader
White Belt

Joined: 25 Apr 2013
Posts: 129
|
Post: #107  Posted: Wed Apr 08, 2015 10:01 pm Post subject: Posted: Wed Apr 08, 2015 10:01 pm Post subject: |
 |
|
| AMBY wrote: | | THANKS FOR POSTING ADX/DMI. |
Welcome Keep Reading
@SYSTRADER(Happy Trading)
|
|
| Back to top |
|
 |
systrader
White Belt

Joined: 25 Apr 2013
Posts: 129
|
Post: #108  Posted: Sat Apr 11, 2015 7:41 pm Post subject: The Signature Trade Posted: Sat Apr 11, 2015 7:41 pm Post subject: The Signature Trade |
 |
|
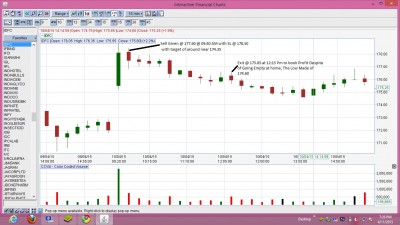
Trade of IDFC The signature Trade never let me down whenever I Trade.
@SYSTRADER(Happy Trading)
| Description: |
|
| Filesize: |
264.22 KB |
| Viewed: |
581 Time(s) |
|
|
|
| Back to top |
|
 |
systrader
White Belt

Joined: 25 Apr 2013
Posts: 129
|
Post: #109  Posted: Sun Apr 12, 2015 9:28 pm Post subject: MACD Indicator Posted: Sun Apr 12, 2015 9:28 pm Post subject: MACD Indicator |
 |
|
MACD Indicator
Moving average Convergence Divergence
The MACD indicator is basically a refinement of the two moving averages system and measures the distance between the two moving average lines. MACD is an acronym for Moving Average Convergence Divergence.
MACD was developed by Gerald Appel and is discussed in his book, The Moving Average Convergence Divergence Trading Method.
MACD Trading Signals
The MACD indicator is primarily used to trade trends and should not be used in a ranging market. Signals are taken when MACD crosses its signal line, calculated as a 9 day exponential moving average of MACD.
Trending Market
First check whether price is trending. If the MACD indicator is flat or stays close to the zero line, the market is ranging and signals are unreliable.
Go long when MACD crosses its signal line from below.
Go short when MACD crosses its signal line from above.
Signals are far stronger if there is either:
a divergence on the MACD indicator; or
a large swing above or below the zero line.
Unless there is a divergence, do not go long if the signal is above the zero line, nor go short if the signal is below zero. Place stop-losses below the last minor Low when long, or the last minor High when short.
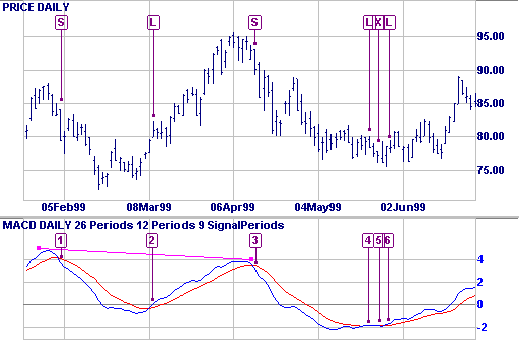
Go short [S] - MACD crosses to below the signal line after a large swing.
Go long [L] when MACD crosses to above the signal line.
Strong short signal [S] - the MACD crosses after a large swing and bearish divergence (shown by the trendline).
Go long [L]. Flat MACD signals that the market is ranging - we are more likely to be whipsawed in/out of our position.
Exit long trade [X] but do not go short - MACD is significantly below the zero line.
Re-enter your long trade [L].
MACD Setup
The default settings for the MACD indicator are:
Slow moving average - 26 days
Fast moving average - 12 days
Signal line - 9 day moving average of the difference between fast and slow.
All moving averages are exponential.
See Indicator Panel for directions on how to set up an indicator. See Edit Indicator Settings to change the settings.
Captions and trendlines: Use MACD Histogram if you want to draw trendlines or place captions on the histogram. Otherwise, they are left "hanging in the air" if you zoom or change time periods.
Interpretation
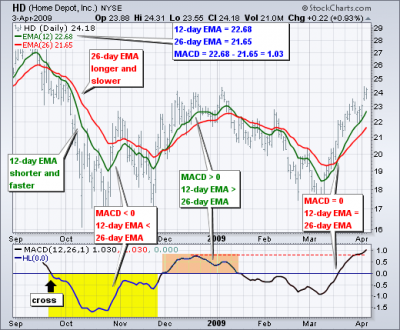
As its name implies, the MACD is all about the convergence and divergence of the two moving averages. Convergence occurs when the moving averages move towards each other. Divergence occurs when the moving averages move away from each other. The shorter moving average (12-day) is faster and responsible for most MACD movements. The longer moving average (26-day) is slower and less reactive to price changes in the underlying security.
The MACD Line oscillates above and below the zero line, which is also known as the centerline. These crossovers signal that the 12-day EMA has crossed the 26-day EMA. The direction, of course, depends on the direction of the moving average cross. Positive MACD indicates that the 12-day EMA is above the 26-day EMA. Positive values increase as the shorter EMA diverges further from the longer EMA. This means upside momentum is increasing. Negative MACD values indicates that the 12-day EMA is below the 26-day EMA. Negative values increase as the shorter EMA diverges further below the longer EMA. This means downside momentum is increasing.
Signal Line Crossovers
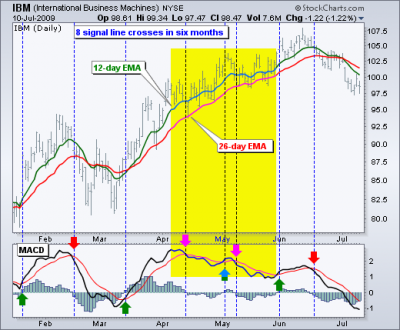
Signal line crossovers are the most common MACD signals. The signal line is a 9-day EMA of the MACD Line. As a moving average of the indicator, it trails the MACD and makes it easier to spot MACD turns. A bullish crossover occurs when the MACD turns up and crosses above the signal line. A bearish crossover occurs when the MACD turns down and crosses below the signal line. Crossovers can last a few days or a few weeks, it all depends on the strength of the move.
Due diligence is required before relying on these common signals. Signal line crossovers at positive or negative extremes should be viewed with caution. Even though the MACD does not have upper and lower limits, chartists can estimate historical extremes with a simple visual assessment. It takes a strong move in the underlying security to push momentum to an extreme. Even though the move may continue, momentum is likely to slow and this will usually produce a signal line crossover at the extremities. Volatility in the underlying security can also increase the number of crossovers.
Centerline Crossovers
Centerline crossovers are the next most common MACD signals. A bullish centerline crossover occurs when the MACD Line moves above the zero line to turn positive. This happens when the 12-day EMA of the underlying security moves above the 26-day EMA. A bearish centerline crossover occurs when the MACD moves below the zero line to turn negative. This happens when the 12-day EMA moves below the 26-day EMA.
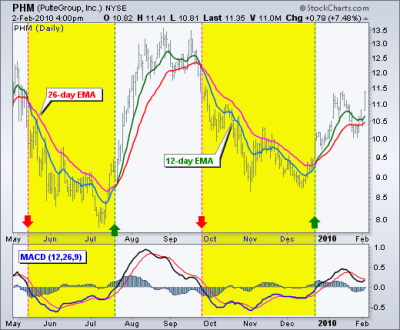
Centerline crossovers can last a few days or a few months. It all depends on the strength of the trend. The MACD will remain positive as long as there is a sustained uptrend. The MACD will remain negative when there is a sustained downtrend. The next chart shows Pulte Homes (PHM) with at least four centerline crosses in nine months. The resulting signals worked well because strong trends emerged with these centerline crossovers.
Divergences
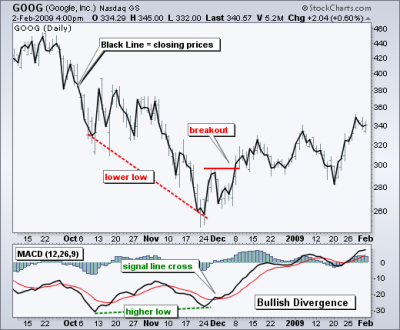
Divergences form when the MACD diverges from the price action of the underlying security. A bullish divergence forms when a security records a lower low and the MACD forms a higher low. The lower low in the security affirms the current downtrend, but the higher low in the MACD shows less downside momentum. Despite less downside momentum, downside momentum is still outpacing upside momentum as long as the MACD remains in negative territory. Slowing downside momentum can sometimes foreshadows a trend reversal or a sizable rally.
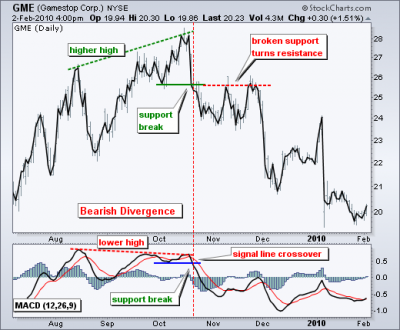
A bearish divergence forms when a security records a higher high and the MACD Line forms a lower high. The higher high in the security is normal for an uptrend, but the lower high in the MACD shows less upside momentum. Even though upside momentum may be less, upside momentum is still outpacing downside momentum as long as the MACD is positive. Waning upward momentum can sometimes foreshadow a trend reversal or sizable decline.
Divergences should be taken with caution. Bearish divergences are commonplace in a strong uptrend, while bullish divergences occur often in a strong downtrend. Yes, you read that right. Uptrends often start with a strong advance that produces a surge in upside momentum (MACD). Even though the uptrend continues, it continues at a slower pace that causes the MACD to decline from its highs. Upside momentum may not be as strong, but upside momentum is still outpacing downside momentum as long as the MACD Line is above zero. The opposite occurs at the beginning of a strong downtrend.
Conclusions
The MACD indicator is special because it brings together momentum and trend in one indicator. This unique blend of trend and momentum can be applied to daily, weekly or monthly charts. The standard setting for MACD is the difference between the 12 and 26-period EMAs. Chartists looking for more sensitivity may try a shorter short-term moving average and a longer long-term moving average. MACD(5,35,5) is more sensitive than MACD(12,26,9) and might be better suited for weekly charts. Chartists looking for less sensitivity may consider lengthening the moving averages. A less sensitive MACD will still oscillate above/below zero, but the centerline crossovers and signal line crossovers will be less frequent.
The MACD is not particularly good for identifying overbought and oversold levels. Even though it is possible to identify levels that are historically overbought or oversold, the MACD does not have any upper or lower limits to bind its movement. During sharp moves, the MACD can continue to over-extend beyond its historical extremes.
Finally, remember that the MACD Line is calculated using the actual difference between two moving averages. This means MACD values are dependent on the price of the underlying security.
@SYSTRADER(Happy Trading)
Coming Soon with next Indicator........................
| Description: |
|
| Filesize: |
5.62 KB |
| Viewed: |
2946 Time(s) |
|
| Description: |
|
| Filesize: |
41.33 KB |
| Viewed: |
443 Time(s) |
|
| Description: |
|
| Filesize: |
38.55 KB |
| Viewed: |
443 Time(s) |
|
| Description: |
|
| Filesize: |
36.87 KB |
| Viewed: |
469 Time(s) |
|
| Description: |
|
| Filesize: |
33.96 KB |
| Viewed: |
449 Time(s) |
|
| Description: |
|
| Filesize: |
44.29 KB |
| Viewed: |
449 Time(s) |
|
|
|
| Back to top |
|
 |
AMBY
Yellow Belt

Joined: 05 Sep 2014
Posts: 503
|
Post: #110  Posted: Mon Apr 13, 2015 8:39 am Post subject: Posted: Mon Apr 13, 2015 8:39 am Post subject: |
 |
|
VERY GOOD ARTICLE ON MACD.
WAITING FOR NEXT INDICATOR.
|
|
| Back to top |
|
 |
systrader
White Belt

Joined: 25 Apr 2013
Posts: 129
|
Post: #111  Posted: Mon Apr 13, 2015 7:53 pm Post subject: Reply Posted: Mon Apr 13, 2015 7:53 pm Post subject: Reply |
 |
|
| AMBY wrote: | VERY GOOD ARTICLE ON MACD.
WAITING FOR NEXT INDICATOR. |
Welcome
@SYSTRADER(Happy Trading)
|
|
| Back to top |
|
 |
Amitsh27
White Belt

Joined: 20 Dec 2012
Posts: 47
|
Post: #112  Posted: Tue Apr 14, 2015 11:29 am Post subject: Re: The Signature Trade Posted: Tue Apr 14, 2015 11:29 am Post subject: Re: The Signature Trade |
 |
|
| systrader wrote: | Trade of IDFC The signature Trade never let me down whenever I Trade.
@SYSTRADER(Happy Trading) |
Hi,
Can you pl explain the basis of your entry/exit? what is this Signature Trick ?
Thankss
|
|
| Back to top |
|
 |
systrader
White Belt

Joined: 25 Apr 2013
Posts: 129
|
Post: #113  Posted: Wed Apr 15, 2015 8:17 pm Post subject: Rcom Intraday Position Posted: Wed Apr 15, 2015 8:17 pm Post subject: Rcom Intraday Position |
 |
|
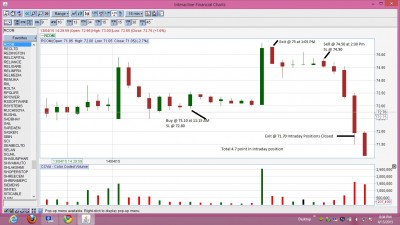
Rcom Buy Gives 1.9 Points
Rcom Sell Gives 2.8 Points
Total Points Earned = 4.7
@SYSTRADER(Happy Trading)
| Description: |
|
| Filesize: |
256.06 KB |
| Viewed: |
515 Time(s) |
|
|
|
| Back to top |
|
 |
systrader
White Belt

Joined: 25 Apr 2013
Posts: 129
|
Post: #114  Posted: Wed Apr 15, 2015 8:32 pm Post subject: Nifty Intraday position Posted: Wed Apr 15, 2015 8:32 pm Post subject: Nifty Intraday position |
 |
|
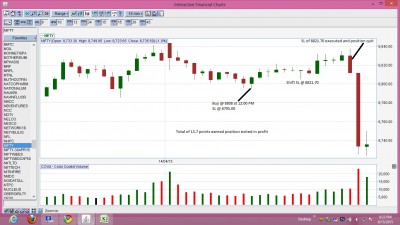
Nifty spot Intraday gave 13.7 points.
@SYSTRADER(Happy Trading)
| Description: |
|
| Filesize: |
233.77 KB |
| Viewed: |
520 Time(s) |
|
Last edited by systrader on Wed Apr 15, 2015 9:20 pm; edited 1 time in total |
|
| Back to top |
|
 |
systrader
White Belt

Joined: 25 Apr 2013
Posts: 129
|
Post: #115  Posted: Wed Apr 15, 2015 9:19 pm Post subject: TataMot Intraday Position Posted: Wed Apr 15, 2015 9:19 pm Post subject: TataMot Intraday Position |
 |
|
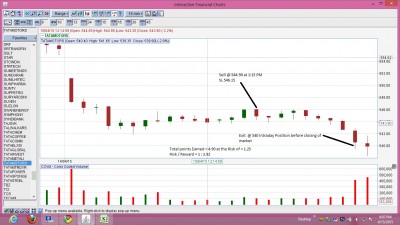
TataMotor Intraday Position gives = 4.90 points
with Risk/Reward = 1 : 3.92
@SYSTRADER(Happy Trading)
| Description: |
| Tata Motor Intraday Position |
|
| Filesize: |
257.72 KB |
| Viewed: |
552 Time(s) |
|
|
|
| Back to top |
|
 |
systrader
White Belt

Joined: 25 Apr 2013
Posts: 129
|
Post: #116  Posted: Sat Apr 18, 2015 9:50 pm Post subject: The Scalper Trade Posted: Sat Apr 18, 2015 9:50 pm Post subject: The Scalper Trade |
 |
|
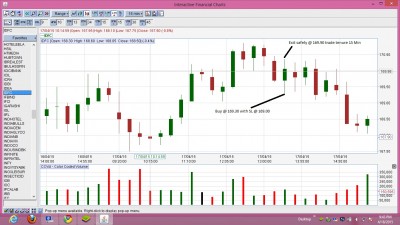
The quick for Quick points in short span of time(due to shortage of time)
Script : IDFC
Entry Point : 169.30
Stop Loss : 169.00
Exit Point : 169.90
Risk : 0.30 Paise
Reward : 0.60 Paise
Risk : Reward = 1 : 2
@SYSTRADER(Happy Trading)
| Description: |
|
| Filesize: |
269.45 KB |
| Viewed: |
557 Time(s) |
|
|
|
| Back to top |
|
 |
systrader
White Belt

Joined: 25 Apr 2013
Posts: 129
|
Post: #117  Posted: Fri Apr 24, 2015 8:27 pm Post subject: Demand based Trading Posted: Fri Apr 24, 2015 8:27 pm Post subject: Demand based Trading |
 |
|
Can any body knows about and have done price based Supply Demand based Trading.................?????
@SYSTRADER(Happy Trading)
|
|
| Back to top |
|
 |
amitagg
Black Belt

Joined: 01 Oct 2013
Posts: 4559
|
Post: #118  Posted: Sat Apr 25, 2015 10:09 pm Post subject: Re: Demand based Trading Posted: Sat Apr 25, 2015 10:09 pm Post subject: Re: Demand based Trading |
 |
|
| systrader wrote: | Can any body knows about and have done price based Supply Demand based Trading.................?????
@SYSTRADER(Happy Trading) |
What's the reasons behind the question
Since there can be difference demand supply zones the strength of which can be tested relying upon other factors ....... I believe demand supply based trading has to be added to ones otherwise developed system......
although experts will say that it alone can work....... Yes mastering it to conceive demand supply zones that shall work and give required RR is needed which then like any other technical analysis system becomes an art in interpretation and therefore become " fallible" also....... 
|
|
| Back to top |
|
 |
systrader
White Belt

Joined: 25 Apr 2013
Posts: 129
|
Post: #119  Posted: Sun Apr 26, 2015 8:05 pm Post subject: Demand based Trading Posted: Sun Apr 26, 2015 8:05 pm Post subject: Demand based Trading |
 |
|
Yh I agree I am trying some thing new till now what did goes right almost 98% but i have to wait a long for signals but still want some more accuracy to trade every time means every time.
@SYSTRADER(Happy Trading)
|
|
| Back to top |
|
 |
systrader
White Belt

Joined: 25 Apr 2013
Posts: 129
|
Post: #120  Posted: Tue Apr 28, 2015 10:37 pm Post subject: Demand based Trading Posted: Tue Apr 28, 2015 10:37 pm Post subject: Demand based Trading |
 |
|
When
if (Demand > Supply)
then
Buy
else
Sell
very simple
if (Bid Qnty > Ask Qnty)
then
Buy
else
Sell
very simple
@SYSTRADER(Happy Trading)
|
|
| Back to top |
|
 |
|

