|
|
| View previous topic :: View next topic |
| From which Method early trend change should get found |
| Moving Averages |
|
16% |
[ 31 ] |
| Indicators |
|
11% |
[ 22 ] |
| Candelstics |
|
33% |
[ 63 ] |
| Mov Avg with Indicators |
|
21% |
[ 40 ] |
| Breakout Trading |
|
17% |
[ 34 ] |
|
| Total Votes : 190 |
|
| Author |
How to catch early TREND REVERSAL |
systrader
White Belt

Joined: 25 Apr 2013
Posts: 129
|
Post: #121  Posted: Sun Jun 28, 2015 10:53 pm Post subject: FORGOTT Posted: Sun Jun 28, 2015 10:53 pm Post subject: FORGOTT |
 |
|
| Every one forgots
|
|
| Back to top |
|
 |
|
| |
systrader
White Belt
Joined: 25 Apr 2013
Posts: 129
|
| Post: #122 Posted: Sun Sep 20, 2015 10:10 pm Post subject: Bollinger Bands |
|
|
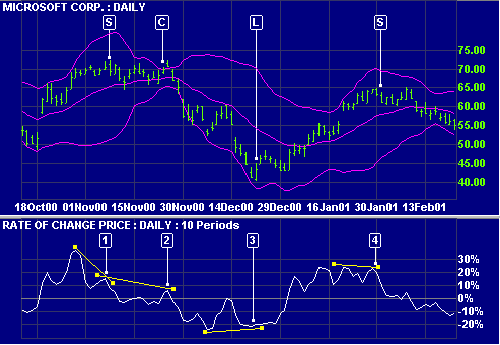
Bollinger Band
Mouse over chart captions to display trading signals.
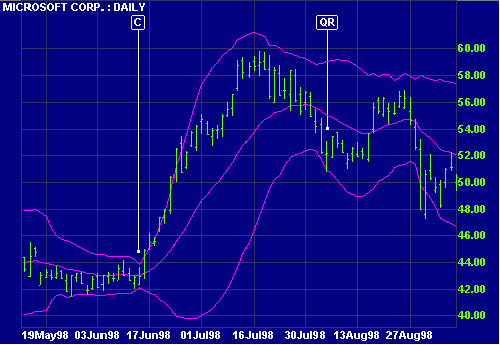
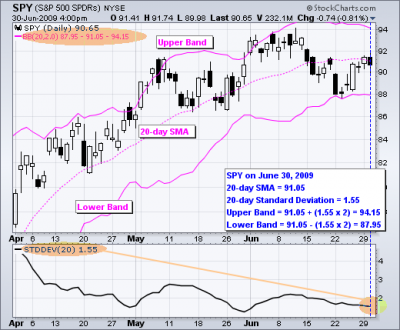
Contracting bands warn that the market is about to trend: the bands first converge into a narrow neck, followed by a sharp price movement. The first breakout is often a false move, preceding a strong trend in the opposite direction. A contracting range [C] is evident in June 1998: the bands converge to a width of $2, followed by a breakout in July to a new high.
A move that starts at one band normally carries through to the other, in a ranging market.
A move outside the band indicates that the trend is strong and likely to continue - unless price quickly reverses. Note the quick reversal [QR] in early August.
A trend that hugs one band signals that the trend is strong and likely to continue. Wait for divergence on a Momentum Indicator to signal the end of a trend.
1.Go short [S] - bearish divergence on ROC.
2.Contracting Bollinger Bands [C] warn of increased volatility. This begins with a false rally (note the ROC triple divergence) followed by a sharp fall.
3.Go long [L] - price hugs the lower band, followed by a bullish divergence on ROC.
4.Go short [S] - price hugs the upper band, followed by a bearish divergence on ROC.
| Description: |
|
| Filesize: |
7.33 KB |
| Viewed: |
3054 Time(s) |
|
| Description: |
|
| Filesize: |
6.03 KB |
| Viewed: |
3054 Time(s) |
|
|
|
| Back to top |
|
|
systrader
White Belt
Joined: 25 Apr 2013
Posts: 129
|
| Post: #123 Posted: Sun Sep 20, 2015 10:19 pm Post subject: Bollinger Bands |
|
|
Bollinger Bands
Bollinger Bands consist of a middle band with two outer bands. The middle band is a simple moving average that is usually set at 20 periods. A simple moving average is used because the standard deviation formula also uses a simple moving average. The look-back period for the standard deviation is the same as for the simple moving average. The outer bands are usually set 2 standard deviations above and below the middle band.
Settings can be adjusted to suit the characteristics of particular securities or trading styles. Bollinger recommends making small incremental adjustments to the standard deviation multiplier. Changing the number of periods for the moving average also affects the number of periods used to calculate the standard deviation. Therefore, only small adjustments are required for the standard deviation multiplier. An increase in the moving average period would automatically increase the number of periods used to calculate the standard deviation and would also warrant an increase in the standard deviation multiplier. With a 20-day SMA and 20-day Standard Deviation, the standard deviation multiplier is set at 2. Bollinger suggests increasing the standard deviation multiplier to 2.1 for a 50-period SMA and decreasing the standard deviation multiplier to 1.9 for a 10-period SMA.
Signal: W-Bottoms
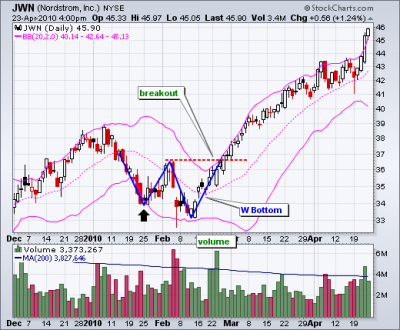
W-Bottoms were part of Arthur Merrill's work that identified 16 patterns with a basic W shape. Bollinger uses these various W patterns with Bollinger Bands to identify W-Bottoms. A “W-Bottom” forms in a downtrend and involves two reaction lows. In particular, Bollinger looks for W-Bottoms where the second low is lower than the first, but holds above the lower band. There are four steps to confirm a W-Bottom with Bollinger Bands. First, a reaction low forms. This low is usually, but not always, below the lower band. Second, there is a bounce towards the middle band. Third, there is a new price low in the security. This low holds above the lower band. The ability to hold above the lower band on the test shows less weakness on the last decline. Fourth, the pattern is confirmed with a strong move off the second low and a resistance break.
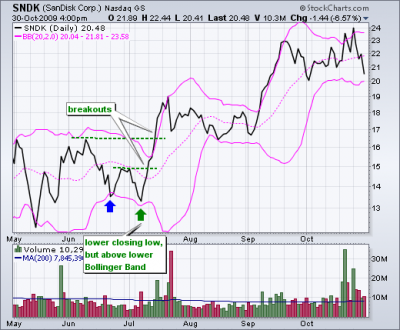
Chart 2 shows Nordstrom (JWN) with a W-Bottom in January-February 2010. First, the stock formed a reaction low in January (black arrow) and broke below the lower band. Second, there was a bounce back above the middle band. Third, the stock moved below its January low and held above the lower band. Even though the 5-Feb spike low broke the lower band, Bollinger Bands are calculated using closing prices so signals should also be based on closing prices. Fourth, the stock surged with expanding volume in late February and broke above the early February high. Chart 3 shows Sandisk with a smaller W-Bottom in July-August 2009.
Signal: M-Tops
M-Tops were also part of Arthur Merrill's work that identified 16 patterns with a basic M shape. Bollinger uses these various M patterns with Bollinger Bands to identify M Bottoms. According to Bollinger, tops are usually more complicated and drawn out than bottoms. Double tops, head-and-shoulders patterns and diamonds represent evolving tops.
In its most basic form, an M-Top is similar to a double top. However, the reaction highs are not always equal. The first high can be higher or lower than the second high. Bollinger suggests looking for signs of non-confirmation when a security is making new highs. This is basically the opposite of the W-Bottom. A non-confirmation occurs with three steps. First, a security forges a reaction high above the upper band. Second, there is a pullback towards the middle band. Third, prices move above the prior high, but fail to reach the upper band. This is a warning sign. The inability of the second reaction high to reach the upper band shows waning momentum, which can foreshadow a trend reversal. Final confirmation comes with a support break or bearish indicator signal.
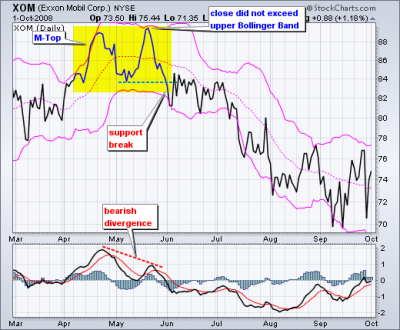
Chart 4 shows Exxon Mobil (XOM) with an M-Top in April-May 2008. The stock moved above the upper band in April. There was a pullback in May and then another push above 90. Even though the stock moved above the upper band on an intraday basis, it did not CLOSE above the upper band. The M-Top was confirmed with a support break two weeks later. Also notice that MACD formed a bearish divergence and moved below its signal line for confirmation.
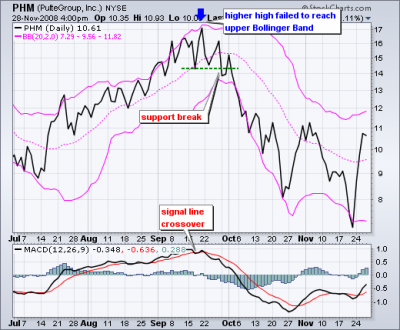
Chart 5 shows Pulte Homes (PHM) within an uptrend in July-August 2008. Price exceeded the upper band in early September to affirm the uptrend. After a pullback below the 20-day SMA (middle Bollinger Band), the stock moved to a higher high above 17. Despite this new high for the move, price did not exceed the upper band. This flashed a warning sign. The stock broke support a week later and MACD moved below its signal line. Notice that this M-top is more complex because there are lower reaction highs on either side of the peak (blue arrow). This evolving top formed a small head-and-shoulders pattern.
Signal: Walking the Bands
Moves above or below the bands are not signals per se. As Bollinger puts it, moves that touch or exceed the bands are not signals, but rather “tags”. On the face of it, a move to the upper band shows strength, while a sharp move to the lower band shows weakness. Momentum oscillators work much the same way. Overbought is not necessarily bullish. It takes strength to reach overbought levels and overbought conditions can extend in a strong uptrend. Similarly, prices can “walk the band” with numerous touches during a strong uptrend. Think about it for a moment. The upper band is 2 standard deviations above the 20-period simple moving average. It takes a pretty strong price move to exceed this upper band. An upper band touch that occurs after a Bollinger Band confirmed W-Bottom would signal the start of an uptrend. Just as a strong uptrend produces numerous upper band tags, it is also common for prices to never reach the lower band during an uptrend. The 20-day SMA sometimes acts as support. In fact, dips below the 20-day SMA sometimes provide buying opportunities before the next tag of the upper band.
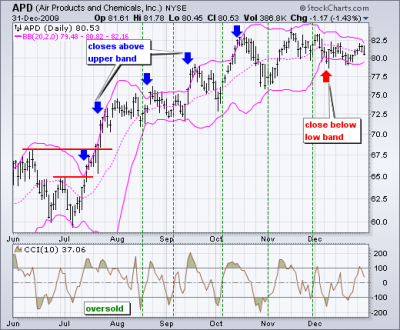
Chart 6 shows Air Products (APD) with a surge and close above the upper band in mid July. First, notice that this is a strong surge that broke above two resistance levels. A strong upward thrust is a sign of strength, not weakness. Trading turned flat in August and the 20-day SMA moved sideways. The Bollinger Bands narrowed, but APD did not close below the lower band. Prices, and the 20-day SMA, turned up in September. Overall, APD closed above the upper band at least five times over a four month period. The indicator window shows the 10-period Commodity Channel Index (CCI). Dips below -100 are deemed oversold and moves back above -100 signal the start of an oversold bounce (green dotted line). The upper band tag and breakout started the uptrend. CCI then identified tradable pullbacks with dips below -100. This is an example of combining Bollinger Bands with a momentum oscillator for trading signals.
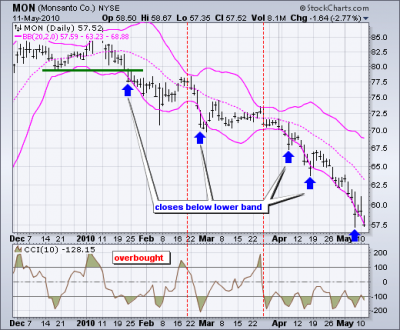
Chart 7 shows Monsanto (MON) with a walk down the lower band. The stock broke down in January with a support break and closed below the lower band. From mid January until early May, Monsanto closed below the lower band at least five times. Notice that the stock did not close above the upper band once during this period. The support break and initial close below the lower band signaled a downtrend. As such, the 10-period Commodity Channel Index (CCI) was used to identify short-term overbought situations. A move above +100 is overbought. A move back below +100 signals a resumption of the downtrend (red arrows). This system triggered two good signals in early 2010.
Conclusions
Bollinger Bands reflect direction with the 20-period SMA and volatility with the upper/lower bands. As such, they can be used to determine if prices are relatively high or low. According to Bollinger, the bands should contain 88-89% of price action, which makes a move outside the bands significant. Technically, prices are relatively high when above the upper band and relatively low when below the lower band. However, relatively high should not be regarded as bearish or as a sell signal. Likewise, relatively low should not be considered bullish or as a buy signal. Prices are high or low for a reason. As with other indicators, Bollinger Bands are not meant to be used as a stand alone tool. Chartists should combine Bollinger Bands with basic trend analysis and other indicators for confirmation.
@SYSTRADER( Happy Trading)
| Description: |
|
| Filesize: |
62.41 KB |
| Viewed: |
474 Time(s) |
|
| Description: |
|
| Filesize: |
41.04 KB |
| Viewed: |
441 Time(s) |
|
| Description: |
|
| Filesize: |
47.08 KB |
| Viewed: |
425 Time(s) |
|
| Description: |
|
| Filesize: |
49.88 KB |
| Viewed: |
431 Time(s) |
|
| Description: |
|
| Filesize: |
41.77 KB |
| Viewed: |
421 Time(s) |
|
| Description: |
|
| Filesize: |
36.87 KB |
| Viewed: |
426 Time(s) |
|
| Description: |
|
| Filesize: |
34.13 KB |
| Viewed: |
426 Time(s) |
|
|
|
| Back to top |
|
|
AMBY
Yellow Belt

Joined: 05 Sep 2014
Posts: 503
|
| Post: #124 Posted: Mon Sep 21, 2015 8:30 am Post subject: |
|
|
THANKS FOR BOLLINGER BANDS WITH CHARTS, IT CLEARED LOTS OF DOUBTS,
PLEASE DO POST MORE ON VARIOUS INDICATORS.
|
|
| Back to top |
|
|
systrader
White Belt
Joined: 25 Apr 2013
Posts: 129
|
| Post: #125 Posted: Sat Sep 26, 2015 11:16 pm Post subject: Trade Script |
|
|
Trade Script Programming
@SYSTRADER(Happy Trading)
| Description: |
|

Download |
| Filename: |
TradeScript.pdf |
| Filesize: |
899.97 KB |
| Downloaded: |
1380 Time(s) |
|
|
| Back to top |
|
|
acharyams
Yellow Belt
Joined: 04 Jul 2010
Posts: 552
|
| Post: #126 Posted: Sun Sep 27, 2015 4:53 pm Post subject: Re: Trade Script |
|
|
| systrader wrote: | Trade Script Programming
@SYSTRADER(Happy Trading) |
Isko use kaise kare?
|
|
| Back to top |
|
|
kamal.icharts
Site Admin
Joined: 10 Apr 2013
Posts: 576
|
| Post: #127 Posted: Mon Sep 28, 2015 10:00 am Post subject: Re: Trade Script |
|
|
Dear Member,
TradeScript is programming language which is used for Scanner and Alerts. It is available in Platinum Charts.
Regards
Kamal
| acharyams wrote: | | systrader wrote: | Trade Script Programming
@SYSTRADER(Happy Trading) |
Isko use kaise kare? |
|
|
| Back to top |
|
|
manass
White Belt
Joined: 21 Sep 2009
Posts: 172
|
| Post: #128 Posted: Mon Oct 12, 2015 9:35 am Post subject: Re: Trade Script |
|
|
Useful thread...
Thanks
| kamal.icharts wrote: | Dear Member,
TradeScript is programming language which is used for Scanner and Alerts. It is available in Platinum Charts.
Regards
Kamal
| acharyams wrote: | | systrader wrote: | Trade Script Programming
@SYSTRADER(Happy Trading) |
Isko use kaise kare? |
|
|
|
| Back to top |
|
|
systrader
White Belt
Joined: 25 Apr 2013
Posts: 129
|
| Post: #129 Posted: Tue Oct 20, 2015 11:20 pm Post subject: Entry & Exit Setup |
|
|
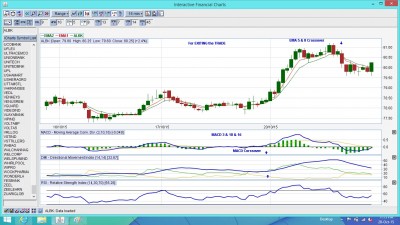
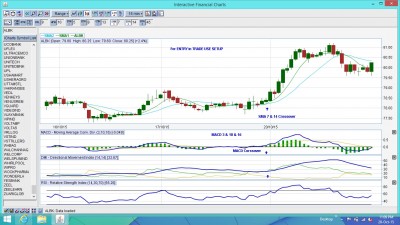
The Entry and Exit Strategy into TRADE
@Systrader(Happy Trading)
| Description: |
|
| Filesize: |
316.5 KB |
| Viewed: |
590 Time(s) |
|
| Description: |
|
| Filesize: |
315.31 KB |
| Viewed: |
573 Time(s) |
|
|
|
| Back to top |
|
|
systrader
White Belt
Joined: 25 Apr 2013
Posts: 129
|
| Post: #130 Posted: Wed Dec 28, 2016 11:55 pm Post subject: Hi |
|
|
| IT HAS BEEN SINCE LAST YEAR OCTOBER i DIDN'T PUT ANY ARTICAL IN THE FORUM DUE TO LACK OF TIME
|
|
| Back to top |
|
|
systrader
White Belt
Joined: 25 Apr 2013
Posts: 129
|
| Post: #131 Posted: Thu Dec 29, 2016 12:12 am Post subject: Analysis |
|
|
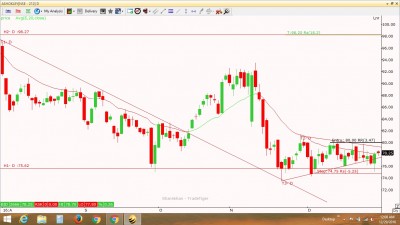
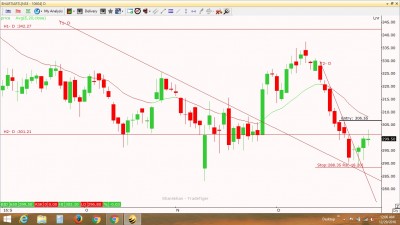
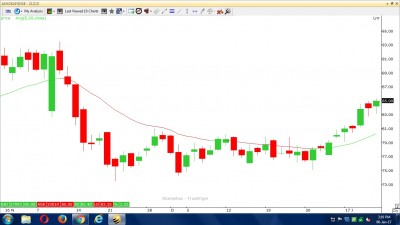
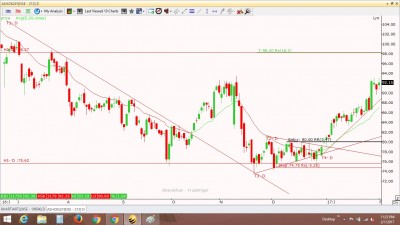
Based on Technical there should be Probable Buy in
1) Ashok Leyland @ 80 with SL @ 74.75 with TGT @ 98.20
2) BhartiArt @ 306.55 with SL @ 288.35 having TGT Open
@Systrader(Happy Trading)
| Description: |
|
| Filesize: |
195.68 KB |
| Viewed: |
417 Time(s) |
|
| Description: |
|
| Filesize: |
193.61 KB |
| Viewed: |
414 Time(s) |
|
|
|
| Back to top |
|
|
AMBY
Yellow Belt
Joined: 05 Sep 2014
Posts: 503
|
| Post: #132 Posted: Thu Dec 29, 2016 7:49 am Post subject: |
|
|
| Welcome after long gap.,
|
|
| Back to top |
|
|
systrader
White Belt
Joined: 25 Apr 2013
Posts: 129
|
| Post: #133 Posted: Fri Jan 06, 2017 3:15 pm Post subject: Re: Analysis |
|
|
| systrader wrote: | Based on Technical there should be Probable Buy in
1) Ashok Leyland @ 80 with SL @ 74.75 with TGT @ 98.20
2) BhartiArt @ 306.55 with SL @ 288.35 having TGT Open
@Systrader(Happy Trading) |
| Description: |
|
| Filesize: |
139.56 KB |
| Viewed: |
386 Time(s) |
|
| Description: |
|
| Filesize: |
150.86 KB |
| Viewed: |
369 Time(s) |
|
|
|
| Back to top |
|
|
systrader
White Belt
Joined: 25 Apr 2013
Posts: 129
|
| Post: #134 Posted: Wed Feb 01, 2017 11:27 pm Post subject: Re: Analysis |
|
|
| systrader wrote: | | systrader wrote: | Based on Technical there should be Probable Buy in
1) Ashok Leyland @ 80 with SL @ 74.75 with TGT @ 98.20
2) BhartiArt @ 306.55 with SL @ 288.35 having TGT Open
@Systrader(Happy Trading) |
|
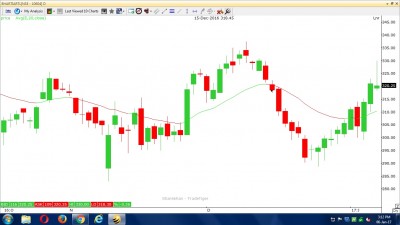
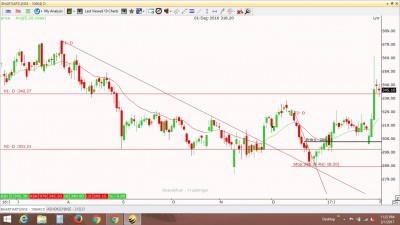
Exit Bharti Airtel @ current Profit = 345.55-306.55 == Rs 39/ Share
Continue with Ashok Ley
@Systrader(Happy Trading)
| Description: |
|
| Filesize: |
198.59 KB |
| Viewed: |
395 Time(s) |
|
| Description: |
|
| Filesize: |
211.5 KB |
| Viewed: |
350 Time(s) |
|
|
|
| Back to top |
|
|
AMBY
Yellow Belt
Joined: 05 Sep 2014
Posts: 503
|
| Post: #135 Posted: Thu Feb 02, 2017 8:06 am Post subject: |
|
|
Thanks for update. 
|
|
| Back to top |
|
|
|
|
You cannot post new topics in this forum
You cannot reply to topics in this forum
You cannot edit your posts in this forum
You cannot delete your posts in this forum
You cannot vote in polls in this forum
You can attach files in this forum
You can download files in this forum
|
Powered by phpBB © 2001, 2005 phpBB Group
|
|
|


