|
|
| View previous topic :: View next topic |
| From which Method early trend change should get found |
| Moving Averages |
|
16% |
[ 31 ] |
| Indicators |
|
11% |
[ 22 ] |
| Candelstics |
|
33% |
[ 63 ] |
| Mov Avg with Indicators |
|
21% |
[ 40 ] |
| Breakout Trading |
|
17% |
[ 34 ] |
|
| Total Votes : 190 |
|
| Author |
How to catch early TREND REVERSAL |
systrader
White Belt

Joined: 25 Apr 2013
Posts: 129
|
Post: #46  Posted: Sat Feb 15, 2014 8:53 pm Post subject: THINGS NOT EXPECTED FROM DAY TRADERS Posted: Sat Feb 15, 2014 8:53 pm Post subject: THINGS NOT EXPECTED FROM DAY TRADERS |
 |
|
THINGS NOT EXPECTED FROM DAY TRADERS
| Description: |
| THINGS NOT EXPECTED FROM DAY TRADERS |
|

Download |
| Filename: |
New Microsoft Office Word Document.doc |
| Filesize: |
30 KB |
| Downloaded: |
789 Time(s) |
|
|
| Back to top |
|
 |
|
| |
Premothi
White Belt
Joined: 07 Sep 2013
Posts: 39
|
| Post: #47 Posted: Sun Feb 16, 2014 10:46 am Post subject: |
|
|
| Rebel wrote: | systrader,
i would like to add an option named heikin-ashi candle patterns.just plot them and try yourself....it helps alot to catch trends virtually. |
Hi Rebel,
Have been following Heiken Ashi since I read your post and am very impressed with its effectiveness.
A little confused on TF though....for intraday should we use 5mts or 15mts? Your experience will be helpful...thanks for the input.
|
|
| Back to top |
|
|
sambhaji_t
White Belt
Joined: 31 Mar 2008
Posts: 135
|
| Post: #48 Posted: Sun Feb 16, 2014 12:18 pm Post subject: |
|
|
| pkholla wrote: | systrader: there is an IC provided indicator in J Ch Premium which is called DMA: displaced moving average.
Try the settings 8 periods MA and 3 periods displacement to the LEFT. Either arith or expon will do as per your appetite.
When the DMA cuts into the price line then trend is less and it MAY be an alert for you to exit the trade
Always use with other indicator/s that you trust
Prakash Holla |
Sir,
Please elaborate DMA setup.
Thanks in advance
|
|
| Back to top |
|
|
chandrujimrc
Brown Belt

Joined: 21 Apr 2009
Posts: 1683
|
| Post: #49 Posted: Sun Feb 16, 2014 12:59 pm Post subject: |
|
|
Dear systrader,
I read the post some times earlier in which the TGT finding formulla was given which is below and TGT finding formulla works try this Exceptions are there but only few.
TARGET FORMULA FOR BUY POSITION
BUY TGT = { OPEN + (OPEN PRICE * 0.75 %)}
TARGET FORMULA FOR SELL POSITION
SELL TGT= {OPEN-(OPEN PRICE * 0.75)}
NOTE:- THIS METHOD ONLY USE INTRADAY
Thanks
@SYSTRADER
Last edited by systrader on 15 Feb 2014 12:54; edited 1 time in total
Pl explain in deatail.
|
|
| Back to top |
|
|
saumya12
Brown Belt
Joined: 21 Dec 2011
Posts: 1509
|
| Post: #50 Posted: Sun Feb 16, 2014 2:55 pm Post subject: Re: TARGET Finding formulla |
|
|
| systrader wrote: | I read the post some times earlier in which the TGT finding formulla was given which is below and TGT finding formulla works try this Exceptions are there but only few.
TARGET FORMULA FOR BUY POSITION
BUY TGT = { OPEN + (OPEN PRICE * 0.75 %)}
TARGET FORMULA FOR SELL POSITION
SELL TGT= {OPEN-(OPEN PRICE * 0.75)}
NOTE:- THIS METHOD ONLY USE INTRADAY
Thanks
@SYSTRADER |
I do not think if this formula will be of any use.
As it gives the Buy-Sell range of + 0.75% each side of the open price
In other words it gives
Buy target to be 100.75 and sell target to be 99.25 for a scrip with open price of 100.
|
|
| Back to top |
|
|
pkholla
Black Belt

Joined: 04 Nov 2010
Posts: 2890
|
| Post: #51 Posted: Sun Feb 16, 2014 5:14 pm Post subject: |
|
|
| sambhaji_t wrote: | | pkholla wrote: | | systrader: there is an IC provided indicator in J Ch Premium which is called DMA: displaced moving average. Try the settings 8 periods MA and 3 periods displacement to the LEFT. Either arith or expon will do as per your appetite. When the DMA cuts into the price line then trend is less and it MAY be an alert for you to exit the trade Always use with other indicator/s that you trust Prakash Holla |
Sir, Please elaborate DMA setup. Thanks in advance |
Sambhaji: Prakash, no sir (not from pasta pseculiar party!)
1 enter J charts premium
2 select scrip
3 just above main chart area, on top left side, there is indicator box marked DMA click on it
4 select options : 8 periods MA, 3 periods shift, left, either arithmetic OR exponential is OK
5 select OK and apply
6 DMA indicator box glows with white color indicating ON
You will see the DMA line forming continuously to the left of the main price line. When DMA cuts into price line GOING UP then bullish is over and you should exit. Similarly when going down, will indicate end of bearishness
See historical charts of NF etc to see how DMA gives signal
NOTE: You can use with another indicator called PARSAR, when both cut into price line then signal is stronger that bull/ bear phase is OVER and price is moving sideways OR reversing
Always use with caution
|
|
| Back to top |
|
|
sambhaji_t
White Belt
Joined: 31 Mar 2008
Posts: 135
|
| Post: #52 Posted: Sun Feb 16, 2014 6:12 pm Post subject: |
|
|
PKHOLLA Sir,
My confusion is - for current 3 days the DMA line remains straight so which should be point of intersection considered for entry/exit. Please show on chart.
Regards
|
|
| Back to top |
|
|
pkholla
Black Belt
Joined: 04 Nov 2010
Posts: 2890
|
| Post: #53 Posted: Sun Feb 16, 2014 7:35 pm Post subject: |
|
|
| sambhaji_t wrote: | | PKHOLLA Sir, My confusion is - for current 3 days the DMA line remains straight so which should be point of intersection considered for entry/exit. Please show on chart. Regards |
Sambhaji: 'Prakash', no sir, please. Or I will stop answering you!
Every indicator is only as good as the data available to it. DMA obviously has no data from future trading.
You can try projecting the DMA line direction, before it becomes straight, and see where that projection cuts price line and use that price for your target
Thats why I requested you to also use PARSAR. If both give same price point then the signal is that much stronger and reliable
And thats also why I requested you to look at historic charts and see how BOTH DMA and PARSAR go towards price line when trend becomes less. Use both and I am confident you will get some advance warning that the scrip you are watching is showing less and less trend AND it may be time to exit long/ short or at least get ready for exiting!
Nothing is perfect in life so you should also keep strict SL and try to part book from time to time
Cheers, Prakash Holla
Let me add some fantastic advice from Al Brooks: Always have at least 2 good reasons to enter a trade.
I would add from my experience that always have at least 2 indicators to guide you after entry!
|
|
| Back to top |
|
|
meherp
White Belt
Joined: 26 Feb 2012
Posts: 67
|
| Post: #54 Posted: Sun Feb 16, 2014 9:51 pm Post subject: Re: hi |
|
|
 
| SUNIL_PATIL_34 wrote: | | hi i m using rsi 5 on daily to see the +ve or -ve divergence is there now for what is divergence who dont know google serch and study!! |
|
|
| Back to top |
|
|
systrader
White Belt
Joined: 25 Apr 2013
Posts: 129
|
| Post: #55 Posted: Mon Feb 17, 2014 9:07 pm Post subject: hi |
|
|
| sambhaji_t wrote: | | pkholla wrote: | systrader: there is an IC provided indicator in J Ch Premium which is called DMA: displaced moving average.
Try the settings 8 periods MA and 3 periods displacement to the LEFT. Either arith or expon will do as per your appetite.
When the DMA cuts into the price line then trend is less and it MAY be an alert for you to exit the trade
Always use with other indicator/s that you trust
Prakash Holla |
Sir,
Please elaborate DMA setup.
Thanks in advance |
Sir ji
DMA setup ki toh baat mat hi karo jabhi aap DMA ki testing karte ho toh saaab thik lagta hai par jab live market me karoge toh bahut if & but aate hain and bade time tak dilema me hote ho 3 period displacement ka matlab hai ki 3 candles ke baad hi buy ya sell ki confirmation kar paoge...
|
|
| Back to top |
|
|
systrader
White Belt
Joined: 25 Apr 2013
Posts: 129
|
| Post: #56 Posted: Mon Feb 17, 2014 9:16 pm Post subject: hi |
|
|
| sambhaji_t wrote: | PKHOLLA Sir,
My confusion is - for current 3 days the DMA line remains straight so which should be point of intersection considered for entry/exit. Please show on chart.
Regards |
Thats why left the use of DMA much earlier from now!
Thanks
@SYSTRADER
|
|
| Back to top |
|
|
systrader
White Belt
Joined: 25 Apr 2013
Posts: 129
|
| Post: #57 Posted: Mon Feb 17, 2014 9:38 pm Post subject: All About Moving Averages |
|
|
Moving averages
Moving averages help us to first define the trend and second, to recognize changes in the trend. That's it. There is nothing else that they are good for. Any thing else is just a waste of time.
I won't be getting into the gory details about how they are constructed. There are about a zillion websites that will explain the mathematical make-up of them. I'll let you do that on your own one day when you are extremely bored out of your mind! But all you really have to know is that a moving average line is just the average price of a stock over time. That's it.
The two moving averages
I use two moving averages: the 10 period simple moving average (SMA) and the 30 period exponential moving average (EMA). I like to use a slower one and a faster one. Why? Because when the faster one (10) crosses over the slower one (30), it will often signal a trend change.
Here are the rules:
Focus on long positions only when the 10 SMA is above the 30 EMA. Focus on short positions only when the 10 SMA is below the 30 EMA. It doesn't get any simpler than that and it will ALWAYS keep you on the right side of the trend!
Note that moving averages only work well when a stock is trending - not when they are in a trading range. When a stock (or the market itself) becomes "sloppy" then you can ignore moving averages - they won't work!
Here are the important things to remember (for long positions - reverse for short positions.):
The 10 SMA must be above the 30 EMA.
There must be plenty of space in between the moving averages.
Both moving averages must be sloping upward.
The 200 period moving average
The 200 SMA is used to separate bull territory from bear territory. Studies have shown that by focusing on long positions above this line and short positions below this line can give you a slight edge.
You should add this moving averages to all of your charts in all time frames. Yes. weekly charts, daily charts, and intra-day (15 min, 60 min) charts.
The 200 SMA is the most important moving average to have on a stock chart. You will be surprised at how many times a stock will reverse in this area.
Use this to your advantage!
Also, when writing scans for stocks, you can use this as an additional filter to find potential long setups that are above this line and potential short setups that are below this line.
Support and resistance?
Contrary to popular belief, stocks do not find support or run into resistance on moving averages. Many times you will hear traders say, "Hey, look at this stock! It bounced off of the 50 day moving average!"
Wrong!
Why would a stock suddenly bounce off of a line that some trader put on a stock chart? It wouldn't. A stock will only bounce (if you want to call it that) off of significant price levels that occurred in the past - not a line on a chart.
Stocks will reverse (up or down) at price levels that are in close proximity to popular moving averages but they do not reverse at the line itself.
So, suppose you are looking at a chart and you see the stock pulling back to, let's say, the 200 period moving average. Look at the price levels on the chart that proved to be significant support or resistance areas in the past.
Those are the areas where the stock will likely reverse.
|
|
| Back to top |
|
|
systrader
White Belt
Joined: 25 Apr 2013
Posts: 129
|
| Post: #58 Posted: Mon Feb 17, 2014 9:52 pm Post subject: DMA |
|
|
Displaced Moving Average (DMA)
The displaced moving average, DMA, study allows you to shift or center the moving average on the price chart. You specify the length for one or two moving averages. You must then select the number of intervals to displace the moving average(s). That value may be positive or negative. A negative value displaces the moving average to the left of the price bars; it lags the moving average(s). Conversely, a positive value leads the price bars. You may overlay the moving average(s) on the bar chart or display them separately. This study can be used for a variety of different purposes. You may use the study to de-trend the data, for cycle estimation, for phasing and as a simple moving average trading system. Refer to Kaufman's book and Murphy's book for additional details on using the displaced moving average study.
As the study displays on your monitor, the moving averages are simply displaced - moved to the right or left over the price chart. A negative displacement value lags the moving average(s) which can be used to center the moving average on the price chart. For example, a 20 period moving average with a -10 displacement centers the moving average on the price chart.
Remember, the mathematics of a moving average force it to always follow or lag the actual price data. By centering the moving average, you have a more accurate picture of the moving average relative to the current price on the chart.
By using this technique, you can quickly see how the displaced moving average study could be quite useful in locating and estimating cycles. For example, if the expected cycle is 28 periods, you specify a moving average length of 28. The displacement value is then one-half of that value or -14. Try it. What happens to the moving average if you change the displacement value to 14 rather than -14?
You can, of course, use the moving average crossover buy/sell signals. Another approach is to use closing prices with the moving average(s), or you might even use the displaced moving average as an estimate of support or resistance areas on the price chart. Please refer to the moving average study for the suggested trading rules. As you can see, there are a variety of ways to use this study. It only requires a small amount of experimentation on your part.
Parameters:
Period1 (4) - the number of bars, or period, used for the first moving average.
Displacement1 (9) - the number of intervals to displace the first moving average. The value may be positive or negative. A negative value displaces the moving average to the left of the price bars, while a positive value leads the price bars.
Period2 (18 ) - the number of bars, or period, used for the second moving average,
Displacement2 (14) - the number of intervals to displace the second moving average. The value may be positive or negative. A negative value displaces the moving average to the left of the price bars, while a positive value leads the price bars.
Computation
The formula to calculate a simple moving average is repeated below. The formula is as follows:
MAt = (P1 +... + Pn) / n
Mat is the moving average for the current period.
Pn is the price for the nth interval.
n is the number of periods.
FuturesDaily computes the average of the past n intervals and plots the number of periods specified by the displacement value. A negative displacement value lags the moving average(s); it moves the average(s) to the left. A positive displacement value leads the moving average(s); it shifts the moving average(s) to the right. The best way to understand this study is to use it and experiment with it before you attempt to trade it.
|
|
| Back to top |
|
|
systrader
White Belt
Joined: 25 Apr 2013
Posts: 129
|
| Post: #59 Posted: Mon Feb 17, 2014 10:37 pm Post subject: Check It |
|
|
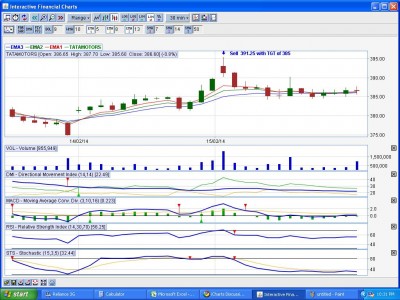
TATA MOTOR Sell@391.25 with TGT@385
| Description: |
|
| Filesize: |
143.5 KB |
| Viewed: |
687 Time(s) |
|
|
|
| Back to top |
|
|
systrader
White Belt
Joined: 25 Apr 2013
Posts: 129
|
| Post: #60 Posted: Wed Feb 19, 2014 10:30 pm Post subject: TRADING SETUP |
|
|
Day trading is all about getting in a rhythm. Over time you will begin to identify day trading setups that consistently work for your trading style.
Whether you have a high win ratio or the average winning profit runs much greater than your losers, you just need to come out ahead.
Your trading style is what makes your market experience unique from everyone else’s. This is where your background, fears, and beliefs all converge in how you view the market. No matter how good the system or the day trading setups placed right before your eyes, if the system is counter to how you view the world, you will not make money.
One of the most popular trading systems of all-times is the Turtle Trading system. The Turtles, as they have been affectionately called, were able to make 100s of millions of dollars trading commodities. That’s right folks, 100s of millions of dollars, but did you know that some of the trainees in the program were let go. Even though these folks received the same training as the other Turtles, some could not grasp the concept of allowing their profits to run. It’s never about the system; it’s about you the trader.
In this article we will cover 6 classic day trading setups you can use to trade the markets. When I say classic, it means these setups would have worked in the 1980s and will continue to work well into the 2030s.
As you study each day trading setup, it’s important to remember you must find the one that matches your trading style the most, in order to have success.
Thanks
@SYSTRADER
Last edited by systrader on Thu Feb 20, 2014 8:15 pm; edited 1 time in total |
|
| Back to top |
|
|
|
|
You cannot post new topics in this forum
You cannot reply to topics in this forum
You cannot edit your posts in this forum
You cannot delete your posts in this forum
You cannot vote in polls in this forum
You can attach files in this forum
You can download files in this forum
|
Powered by phpBB © 2001, 2005 phpBB Group
|
|
|


