| View previous topic :: View next topic |
| From which Method early trend change should get found |
| Moving Averages |
|
16% |
[ 31 ] |
| Indicators |
|
11% |
[ 22 ] |
| Candelstics |
|
33% |
[ 63 ] |
| Mov Avg with Indicators |
|
21% |
[ 40 ] |
| Breakout Trading |
|
17% |
[ 34 ] |
|
| Total Votes : 190 |
|
| Author |
How to catch early TREND REVERSAL |
systrader
White Belt

Joined: 25 Apr 2013
Posts: 129
|
Post: #91  Posted: Mon Mar 23, 2015 3:55 pm Post subject: The Perfect Early trend Prediction without any Indicator Posted: Mon Mar 23, 2015 3:55 pm Post subject: The Perfect Early trend Prediction without any Indicator |
 |
|
This and following messages and attached files shows the perfect prediction of Early Trend catching and without using any Indicator
The Perfect
28 points earned for shorting early behind two positions of nifty.
This is what the early trend reversal does . The points got added on both sides if you catch the trend early.
@SYSTRADER/rohit.kumar4000 (HAPPY TRADING)
| Description: |
| 28 points earned for shorting early behind two positions of nifty. |
|

Download |
| Filename: |
p1.docx |
| Filesize: |
92.59 KB |
| Downloaded: |
642 Time(s) |
|
|
| Back to top |
|
 |
|
|
 |
systrader
White Belt

Joined: 25 Apr 2013
Posts: 129
|
Post: #92  Posted: Tue Mar 24, 2015 8:07 pm Post subject: The Perfect Early Prediction Posted: Tue Mar 24, 2015 8:07 pm Post subject: The Perfect Early Prediction |
 |
|
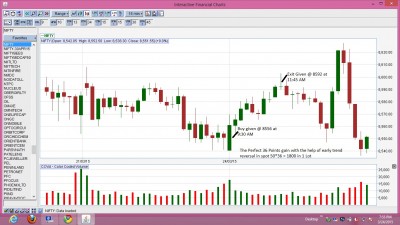
The nifty Early Prediction gives 36 perfect point
@SYSTRADER(Happy Trading)
| Description: |
|
| Filesize: |
272.11 KB |
| Viewed: |
602 Time(s) |
|
|
|
| Back to top |
|
 |
systrader
White Belt

Joined: 25 Apr 2013
Posts: 129
|
Post: #93  Posted: Tue Mar 24, 2015 8:42 pm Post subject: Jindal Steel early Prediction Posted: Tue Mar 24, 2015 8:42 pm Post subject: Jindal Steel early Prediction |
 |
|
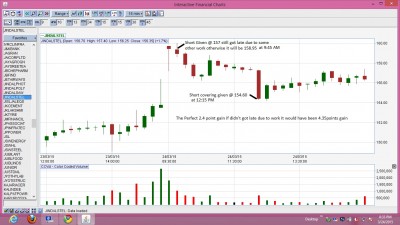
The JINDAL STEEL early prediction of SHORT SELL gave 2.40 points/ 4.35 points
@SYSTRADER(Happy Trading)
| Description: |
| The JINDAL STEEL early prediction of SHORT SELL gave 2.40 points/ 4.35 points |
|
| Filesize: |
255.36 KB |
| Viewed: |
570 Time(s) |
|
|
|
| Back to top |
|
 |
systrader
White Belt

Joined: 25 Apr 2013
Posts: 129
|
Post: #94  Posted: Tue Mar 24, 2015 8:49 pm Post subject: The Perfect three early predicted Shots Posted: Tue Mar 24, 2015 8:49 pm Post subject: The Perfect three early predicted Shots |
 |
|
In the two days three perfect shots have been made.
1) on 23/3/2015 Nifty short sell gives 28 Points
2) on 24/3/2015 Nifty Long gives 36 Points
3) on 24/3/2015 jindal Steel Short sell gives 2.40 or 4.35 Points.
Two Days 66.40 or 68.35 Points
@SYSTRADER(Happy Trading)
|
|
| Back to top |
|
 |
systrader
White Belt

Joined: 25 Apr 2013
Posts: 129
|
Post: #95  Posted: Wed Mar 25, 2015 2:32 pm Post subject: The Prediction for SUVEN Posted: Wed Mar 25, 2015 2:32 pm Post subject: The Prediction for SUVEN |
 |
|
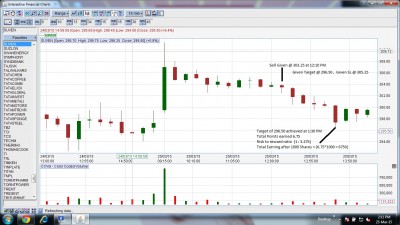
The Prediction for SUVEN gives 6.75 points
@SYSTRADER(Happy Trading)
| Description: |
| The Prediction for SUVEN gives 6.75 points |
|
| Filesize: |
271.25 KB |
| Viewed: |
550 Time(s) |
|
|
|
| Back to top |
|
 |
systrader
White Belt

Joined: 25 Apr 2013
Posts: 129
|
Post: #96  Posted: Thu Mar 26, 2015 9:59 pm Post subject: Technical Analysis Posted: Thu Mar 26, 2015 9:59 pm Post subject: Technical Analysis |
 |
|
Kabhi Kabhi Life me ek weapon "REST" ko bhi use karna jroori hota hai achi gain ke baad it's best strategy to keep rest Instead of going two steps ahead then one and half back.
Always go with
1) Daily Target then Rest if achieved
2) Weekly Target then Rest if achieved
3) The yearly target automatically got achieved and you will got Rest & Peace of Mind too.
@SYSTRADER(Happy Trading)
|
|
| Back to top |
|
 |
amitkbaid1008
Yellow Belt

Joined: 04 Mar 2009
Posts: 540
|
Post: #97  Posted: Thu Mar 26, 2015 10:43 pm Post subject: Re: The Prediction for SUVEN Posted: Thu Mar 26, 2015 10:43 pm Post subject: Re: The Prediction for SUVEN |
 |
|
| systrader wrote: | The Prediction for SUVEN gives 6.75 points
@SYSTRADER(Happy Trading) |
Me too traded almost same trade in SUVEN
Sell @ 303.75 around 12:08
But It just missed by target by 0.15 around 15:09 and I have to exit at 297.70 around 15:15 (my standard square off time) with gain of 6.05
|
|
| Back to top |
|
 |
amitagg
Black Belt

Joined: 01 Oct 2013
Posts: 4559
|
Post: #98  Posted: Thu Mar 26, 2015 11:32 pm Post subject: Posted: Thu Mar 26, 2015 11:32 pm Post subject: |
 |
|
| sherbaaz wrote: | hi,
if you want to catch early trend reversal find where accumulation is ending and go long or find where distribution is ending and go short.
in your poll you have not included volume & momentum to find trend reversal where as...
momentum precedes price, speed of momentum precedes momentum and volume precedes speed of momentum.
If you can find ways/method to see above then u can catch early trend reversal as its not indicators/osc/ma/support & ret etc which changes the trend its imbalance of supply and demand which changes the trend be it a tick chart or a monthly chart.
regds,
[/b] |
hi.
where are u these days!!! behind the scenes.... 
Rgs
|
|
| Back to top |
|
 |
systrader
White Belt

Joined: 25 Apr 2013
Posts: 129
|
Post: #99  Posted: Sat Mar 28, 2015 1:06 am Post subject: Re: The Prediction for SUVEN Posted: Sat Mar 28, 2015 1:06 am Post subject: Re: The Prediction for SUVEN |
 |
|
| amitkbaid1008 wrote: | | systrader wrote: | The Prediction for SUVEN gives 6.75 points
@SYSTRADER(Happy Trading) |
Me too traded almost same trade in SUVEN
Sell @ 303.75 around 12:08
But It just missed by target by 0.15 around 15:09 and I have to exit at 297.70 around 15:15 (my standard square off time) with gain of 6.05 |
Very Nice Amit
@SYSTRADER(Happy Trading)
|
|
| Back to top |
|
 |
systrader
White Belt

Joined: 25 Apr 2013
Posts: 129
|
|
| Back to top |
|
 |
aagarwal
White Belt

Joined: 09 Oct 2014
Posts: 5
|
Post: #101  Posted: Wed Apr 01, 2015 12:37 am Post subject: Posted: Wed Apr 01, 2015 12:37 am Post subject: |
 |
|
| [CONTENT REMOVED BY ADMIN], MESSAGE POSTING ACCESS REMOVED.
|
|
| Back to top |
|
 |
systrader
White Belt

Joined: 25 Apr 2013
Posts: 129
|
Post: #102  Posted: Wed Apr 01, 2015 3:39 am Post subject: Technical Analysis Posted: Wed Apr 01, 2015 3:39 am Post subject: Technical Analysis |
 |
|
In my subsequent posts I m going to discuss some technical indicators usually a Trader uses for trading Like
1. ADX
2. MACD
3. Bollinger Band
4. RSI
5. Stochastic
6. Accumulation Distribution
7. Ebull/ Ebear
8. Fast k, Fast D
9. William R
10. Parabolic SAR
11. Moving Averages
12. Pivot
13. Fibonacci
14.Support & Resistance
and last but not least
15. Candlesticks
From when I started Trading I have almost use every Indicator some times single and some times in combination of all it depends on the type of Position you are going to create If you are going to play INTRADAY it depends upon you whether to use which but for DELIVERY basis the combination of almost all is the best.
@SYSTRADER(Happy Trading) 
|
|
| Back to top |
|
 |
systrader
White Belt

Joined: 25 Apr 2013
Posts: 129
|
Post: #103  Posted: Fri Apr 03, 2015 10:38 pm Post subject: Technical Analysis Posted: Fri Apr 03, 2015 10:38 pm Post subject: Technical Analysis |
 |
|
ADX/DMI
Average Directional Index/ Directional Movement Index
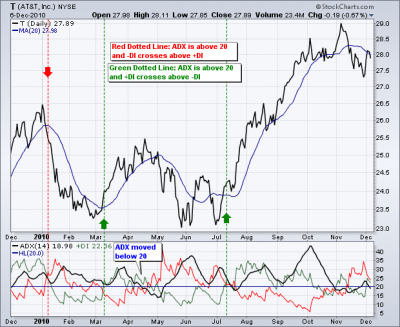
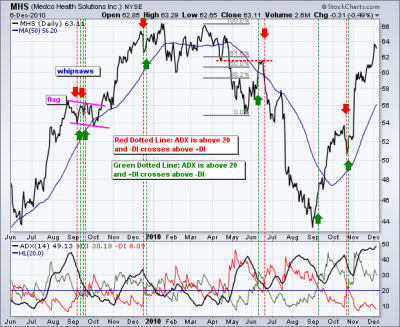
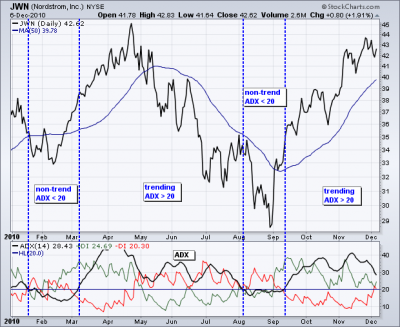
The Average Directional Index (ADX), Minus Directional Indicator (-DI) and Plus Directional Indicator (+DI) represent a group of directional movement indicators that form a trading system developed by Welles Wilder. Wilder designed ADX with commodities and daily prices in mind, but these indicators can also be applied to stocks. The Average Directional Index (ADX) measures trend strength without regard to trend direction. The other two indicators, Plus Directional Indicator (+DI) and Minus Directional Indicator (-DI), complement ADX by defining trend direction. Used together
Interpretation
The Average Directional Index (ADX) is used to measure the strength or weakness of a trend, not the actual direction. Directional movement is defined by +DI and -DI. In general, the bulls have the edge when +DI is greater than - DI, while the bears have the edge when - DI is greater. Crosses of these directional indicators can be combined with ADX for a complete trading system.
Before looking at some signals with examples, keep in mind that Wilder was a commodity and currency trader. The examples in his books are based on these instruments, not stocks. This does not mean his indicators cannot be used with stocks. Some stocks have price characteristics similar to commodities, which tend to be more volatile with short and strong trends. Stocks with low volatility may not generate signals based on Wilder's parameters. Chartists will likely need to adjust the indicator settings or the signal parameters according to the characteristics of the security.
Trend Strength
At its most basic the Average Directional Index (ADX) can be used to determine if a security is trending or not. This determination helps traders choose between a trend following system or a non-trend following system. Wilder suggests that a strong trend is present when ADX is above 25 and no trend is present when below 20. There appears to be a gray zone between 20 and 25. As noted above, chartists may need to adjust the settings to increase sensitivity and signals. ADX also has a fair amount of lag because of all the smoothing techniques. Many technical analysts use 20 as the key level for ADX.
DI Crossover System
Wilder put forth a simple system for trading with these directional movement indicators. The first requirement is for ADX to be trading above 25. This ensures that prices are trending. Many traders, however, use 20 as the key level. A buy signal occurs when +DI crosses above - DI. Wilder based the initial stop on the low of the signal day. The signal remains in force as long as this low holds, even if +DI crosses back below - DI. Wait for this low to be penetrated before abandoning the signal. This bullish signal is reinforced if/when ADX turns up and the trend strengthens. Once the trend develops and becomes profitable, traders will have to incorporate a stop-loss and trailing stop should the trend continue. A sell signal triggers when - DI crosses above +DI. The high on the day of the sell signal becomes the initial stop-loss.
Conclusions
The directional movement indicator calculations are complex, interpretation is straight-forward and successful implementation takes practice. +DI and - DI crossovers are quite frequent and chartists need to filter these signals with complementary analysis. Setting an ADX requirement will reduce signals, but this uber-smoothed indicator tends to filter as many good signals as bad. In other words, chartists might consider moving ADX to the back burner and focusing on the Directional Indicators to generate signals. These crossover signals will be similar to those generated using momentum oscillators. Therefore, chartists need to look elsewhere for confirmation help. Volume-based indicators, basic trend analysis and chart patterns can help distinguish strong crossover signals from weak crossover signals. For example, chartists can focus on +DI buy signals when the bigger trend is up and - DI sell signals when the bigger trend is down.
@SYSTRADER(Happy Trading)
............................................ Coming Soon with next Indicator
| Description: |
|
| Filesize: |
60.28 KB |
| Viewed: |
566 Time(s) |
|
| Description: |
|
| Filesize: |
65.88 KB |
| Viewed: |
506 Time(s) |
|
| Description: |
|
| Filesize: |
58.04 KB |
| Viewed: |
486 Time(s) |
|
Last edited by systrader on Sat Apr 04, 2015 9:20 pm; edited 1 time in total |
|
| Back to top |
|
 |
Allwell
White Belt

Joined: 24 Jan 2010
Posts: 183
|
Post: #104  Posted: Sat Apr 04, 2015 3:33 pm Post subject: Posted: Sat Apr 04, 2015 3:33 pm Post subject: |
 |
|
Systraders....good one...   
|
|
| Back to top |
|
 |
systrader
White Belt

Joined: 25 Apr 2013
Posts: 129
|
Post: #105  Posted: Mon Apr 06, 2015 5:31 pm Post subject: Nifty chart after prediction Posted: Mon Apr 06, 2015 5:31 pm Post subject: Nifty chart after prediction |
 |
|
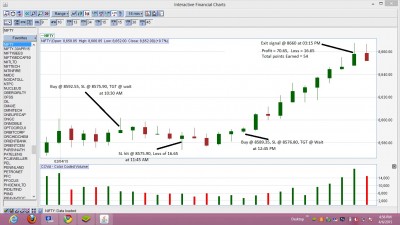
Nifty Buy Generated @ 10:30AM Hit SL @11:45 with loss of 16.65 Points
Nifty Buy Generated @ 12:45PM Generated Profit of 70.65
Total Profit Earned= Profit - Loss = 54 Points
@SYSTRADER(Happy Trading)
| Description: |
|
| Filesize: |
237.46 KB |
| Viewed: |
549 Time(s) |
|
|
|
| Back to top |
|
 |
|

