| View previous topic :: View next topic |
| Author |
How to detect a whipsaw and sideways trend in Day Trading |
pattiboy02
White Belt

Joined: 16 Mar 2009
Posts: 220
|
Post: #1  Posted: Tue Jun 26, 2012 6:53 pm Post subject: How to detect a whipsaw and sideways trend in Day Trading Posted: Tue Jun 26, 2012 6:53 pm Post subject: How to detect a whipsaw and sideways trend in Day Trading |
 |
|
Dear Friends
As a day trader I am constantly find it difficult to detect a whipsaw day and sideways trend on a particular day.
I have following points on whipsaw and need initiative from fellow Ichartians to give suggestion on points:
1. How to detect a Whipsaw day.
2. Whether trading should be done or not on that day
3. If trading can be done after detecting the same, then How to trade on whipsaw day.
Suggestion needed from esteemed Ichartians
Thanks
Regards
Pattiboy
|
|
| Back to top |
|
 |
|
|
|
Gemini
White Belt
Joined: 28 Apr 2009
Posts: 166
|
| Post: #2 Posted: Tue Jun 26, 2012 7:08 pm Post subject: |
|
|
My learnings so far:
ADX (14) on daily chart is one of the recommended indicator. ADX <20> 20 : Trending
It is advisable to use trending indicator (like ema34 or macd ) when the marketing is trending and use oscillator (like RSI, stochastics) when the market is in sideways mode. Many people advise to stay away during sideways days. One can even reduce the volume.
Visual study of the chart on 60 min / 30 min TF (for period of 5 to 10 days) may also provide good clues.
I invite feedback from experienced traders...
|
|
| Back to top |
|
|
Gemini
White Belt
Joined: 28 Apr 2009
Posts: 166
|
| Post: #3 Posted: Tue Jun 26, 2012 7:09 pm Post subject: |
|
|
| Correction: ADX <20> 20 trending...
|
|
| Back to top |
|
|
Gemini
White Belt
Joined: 28 Apr 2009
Posts: 166
|
| Post: #4 Posted: Tue Jun 26, 2012 7:11 pm Post subject: |
|
|
Correction:
ADX (14) is less than 20 then it is considered as sideways, ADX (14) is more than 20, it is considered as trending...
|
|
| Back to top |
|
|
shanticomq
White Belt
Joined: 22 Jan 2011
Posts: 219
|
| Post: #5 Posted: Tue Jun 26, 2012 8:19 pm Post subject: ADX 14 |
|
|
Hi gemini
As per ur view if adx 14 is less than 20(daily chrt) then sideways use RSI & stochastics ok.
if ADX 14 is greater than 20(daily chrt) then trending use EMA 34 or MACD.ok.
In intraday trade which TF to use for RSI,STOCTIS,EMA34,MACD from ur angle for above formula.
Thanks
Sanjay
|
|
| Back to top |
|
|
rameshraja
Expert

Joined: 24 Nov 2006
Posts: 1121
|
| Post: #6 Posted: Tue Jun 26, 2012 8:30 pm Post subject: |
|
|
Mr Pattiboy
Every trader faces this problem.. however smart he is in trading !!
I give you a clue .. Look at icharts levels.. Wonderful levels to trade.
C T RAMESH RAJA
|
|
| Back to top |
|
|
Padkondu
White Belt
Joined: 23 Jan 2008
Posts: 120
|
| Post: #7 Posted: Tue Jun 26, 2012 8:47 pm Post subject: Re: How to detect a whipsaw and sideways trend in Day Tradin |
|
|
| pattiboy02 wrote: | Dear Friends
As a day trader I am constantly find it difficult to detect a whipsaw day and sideways trend on a particular day.
I have following points on whipsaw and need initiative from fellow Ichartians to give suggestion on points:
1. How to detect a Whipsaw day.
2. Whether trading should be done or not on that day
3. If trading can be done after detecting the same, then How to trade on whipsaw day.
Suggestion needed from esteemed Ichartians.
Thanks
Regards
Pattiboy |
Hi I am not a day trader though, i giv u the follwoing suggestion.
ADX
a. use adx values 13,7.
b. adx below 15 is a clear indication of sideways market condition. market moves in a very tight range and only scalpers may make some money and it is better to stay away. but after making a low adx starts an upward journey (moves past 20from the low below 15), whether in down trend or up trend is an indication of starting of a trend. wait for the break out of the range in the direction of trend and trade with tight stop.
c. how ever adx above 20 is an indication of trend in place but be careful when above 40 as profit booking will halt or reverse the trend. no trade when adx is above 60 as the markets will atleas correct to an extent to hit your stop. then wait for a good support/resistance to make an entry.
Avoiding a whipsaw or hitting a stop during a trend.
have the important support resistance values one eod chart, such as weekly/monthly pivot levels. no longs below resistance and no shorts above key supports. most of the times stops are hit though the market may move in the direction of trend later.
regards
Padkondu
|
|
| Back to top |
|
|
worsttrader
White Belt
Joined: 24 May 2008
Posts: 39
|
| Post: #8 Posted: Wed Jun 27, 2012 8:41 am Post subject: |
|
|
| i would suggest that as a day trader you can never miss out on a trade because you might miss a minor or major trend just because you assumed that it was a sideways day. so you will have to decide high and low benchmarks above and below which you will have to trade even if you make losses. It will minimize your losses. Instead of focusing on avoiding a whipsaw or sideways day, focus on minimizing your losses on those days. that way when you make big profits on trending days, they will more than adequately make up for the losses of the sideways days. But you cannot repeat cannot avoid sideways days. That is part of the mythical holy grail and probably does not exist.
|
|
| Back to top |
|
|
smartcancerian
Yellow Belt

Joined: 07 Apr 2010
Posts: 542
|
| Post: #9 Posted: Wed Jun 27, 2012 8:47 am Post subject: |
|
|
Hello all, I tried to use levels in the past..but could not implement properly..so my Question to PT/ST/Veeru/Raja sir & all fellow ichartians..how to enter and exit at a level/number(whether its ichart level/gann number, fib or veeru da number)..suppose level is 5171..so we wait a bullish candle to close (CC)above that number to go long( in which tf to wait) or a bearish CC below this number to exit or go short or as umesh does in gann stsgy..count 100 in mind..what are the possible ways..I hope i am able to put my question properly..  pl enlight.. pl enlight..
|
|
| Back to top |
|
|
rameshraja
Expert
Joined: 24 Nov 2006
Posts: 1121
|
| Post: #10 Posted: Wed Jun 27, 2012 8:10 pm Post subject: |
|
|
Hello smartcancerian
I give you my strategy for trading in Nifty with icharts levels.. you workout and tell me in same fashion what you will do for stocks !!
For Nifty Trading:
Following is the Strategy:
1. Short Nifty 10 points above BULL level. Stop will be 20 points from Bull level.
2. If it crosses 20 points from BULL level it should rock on upside.
3. Buy Nifty 10 points below BEAR Level. Stop will be 20 points from Bear Level.
4. After crossing 20 points above BULL Level and subsequently if it pierces LOC, then Nifty will crash land.
5. After breaching 20 points below BEAR Level and subsequently if it crosses LOC, then it will moveup with momentum.
How do you takeup trades with the above strategy:
1.When you short 10points above BULL Level, then 20th point from BULL Level will become SLR.. and now your TGTS are LOC and BEAR Level
2. When you long 10 points below Bear Level, then 20th point from BEAR Level will become SLR..and now your TGTS are LOC and BULL Level.
You understand upto this point clearly, then I will tell you how to takeup SLR trade and explain you, how powerful is LOC level after Nifty crossing 20 points from either BULL or BEAR Level.
whatever I have explained now, first you backtest icharts levels with charts and revert to me.
For Nifty its 20 points play a vital role and for stocks its different figures taking into account value of stocks.
Best Wishes
C T RAMESH RAJA
|
|
| Back to top |
|
|
dine
White Belt
Joined: 11 Jul 2009
Posts: 73
|
| Post: #11 Posted: Wed Jun 27, 2012 9:22 pm Post subject: |
|
|
Thank you Sir... For forming a trading method around icharts levels and explaining it clearly..
Regards,
Dinesh S.
|
|
| Back to top |
|
|
Ravi_S
Yellow Belt
Joined: 15 Jun 2009
Posts: 569
|
| Post: #12 Posted: Wed Jun 27, 2012 9:31 pm Post subject: |
|
|
Hi Rameshraja
Is this the weekly levels of NF you are talking about?
Regards
Ravi
|
|
| Back to top |
|
|
smartcancerian
Yellow Belt
Joined: 07 Apr 2010
Posts: 542
|
| Post: #13 Posted: Wed Jun 27, 2012 10:34 pm Post subject: |
|
|
| Thanx rameshraja sir for putting the things in simple manner..Definately. i will backtest/papertrade the things for few sessions on Nifty only & will revert back to you to seek your further guidance..one more que which keeps revolving in my mind..is it some mathematical calculations which make price action pivots on which TA(patterns,emas,waves etc) is done or TA comes into play first..but these mathematical numbers provide us some criteria to take entries & exits..Thanx again for the guidance for learners..
|
|
| Back to top |
|
|
dine
White Belt
Joined: 11 Jul 2009
Posts: 73
|
| Post: #14 Posted: Wed Jun 27, 2012 10:36 pm Post subject: |
|
|
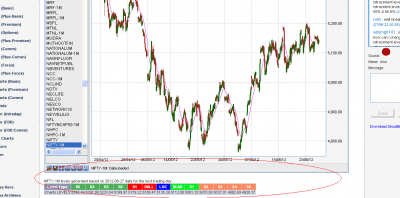
Its the daily ichart levels displayed at the bottom of jcharts-premium.. Refer the image attached.
| Description: |
|
| Filesize: |
69.42 KB |
| Viewed: |
651 Time(s) |
|
|
|
| Back to top |
|
|
smartcancerian
Yellow Belt
Joined: 07 Apr 2010
Posts: 542
|
| Post: #15 Posted: Wed Jun 27, 2012 10:38 pm Post subject: |
|
|
Request to PT/ST sir..if we can have historic ichart levels (intra)..pl provide the link..thanx in advance..even last 10 days will do..(this was the roughest track i faced in intra..  ) )
|
|
| Back to top |
|
|
|


