| View previous topic :: View next topic |
| Author |
HOW TO DRAW ANDREW'S PITCHFORK IN JCHART PREMIUM |
hasten
White Belt

Joined: 30 Jun 2011
Posts: 216
|
Post: #1  Posted: Wed Jun 20, 2012 6:18 pm Post subject: HOW TO DRAW ANDREW'S PITCHFORK IN JCHART PREMIUM Posted: Wed Jun 20, 2012 6:18 pm Post subject: HOW TO DRAW ANDREW'S PITCHFORK IN JCHART PREMIUM |
 |
|
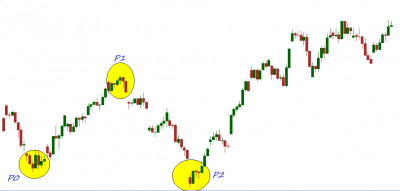
In svkum's thread many Peoples Drawing irregular lines and calling them pitchfork , I suggest to all those who intrested ,to use Andrew's Pitchfork ,first learn how to draw it properly..... then post your chart for entery ,exit or targets.
In jchart there is no tool for Andrews Pitchfork ,So we have to draw it manually with the help of Fibonacci Retracement.
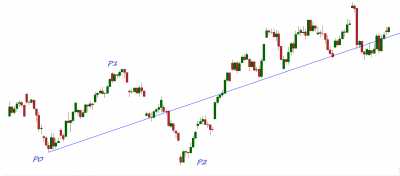
STEP 1. Choose three alternative, consecutive pivots in price (low, high, low – or – high, low, high) and label them P0, P1, and P2.
Regards, hasten
Champions are not Supernatural. They just fight one more second when everyone else quits.
| Description: |
|
| Filesize: |
17.8 KB |
| Viewed: |
713 Time(s) |
|
Last edited by hasten on Wed Jun 20, 2012 7:37 pm; edited 1 time in total |
|
| Back to top |
|
 |
|
|
|
hasten
White Belt
Joined: 30 Jun 2011
Posts: 216
|
| Post: #2 Posted: Wed Jun 20, 2012 6:22 pm Post subject: |
|
|
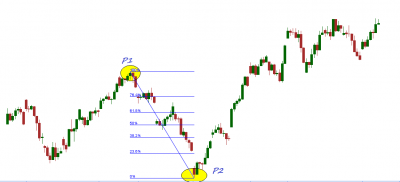
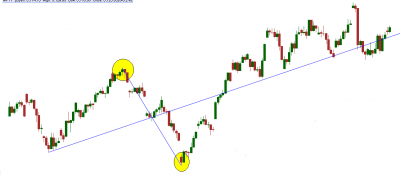
STEP 2. To find the mid-point between the pivots P1 and P2, Draw Fibonacci Retracement from P1 to P2(start at P1 (0%) and end at P2 (100%)[the 50% line will intersect the line between P1 and P2 at the midpoint].
Regards, hasten
You know my method. It is founded upon the observation of trifles. It is, of course, a trifle, but there is nothing so important as trifles.
| Description: |
|
| Filesize: |
22.23 KB |
| Viewed: |
710 Time(s) |
|
Last edited by hasten on Wed Jun 20, 2012 6:36 pm; edited 1 time in total |
|
| Back to top |
|
|
svkum
White Belt
Joined: 14 Feb 2007
Posts: 321
|
| Post: #3 Posted: Wed Jun 20, 2012 6:31 pm Post subject: |
|
|
HASTEN ,
I am happy that you are extending my idea further,by finetuning the process.[b][/b]
|
|
| Back to top |
|
|
hasten
White Belt
Joined: 30 Jun 2011
Posts: 216
|
| Post: #4 Posted: Wed Jun 20, 2012 6:37 pm Post subject: |
|
|
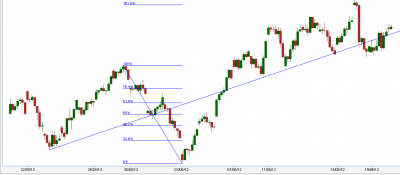
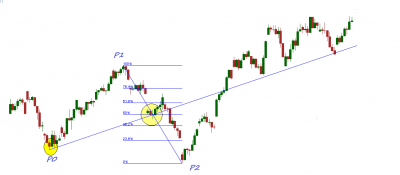
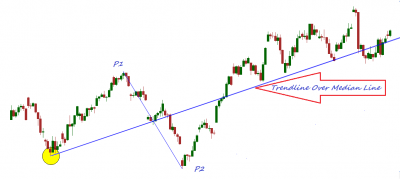
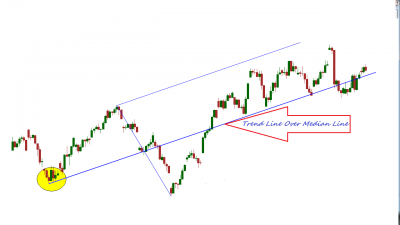
STEP 3. Draw a line from P0 through the midpoint between P1 and P2 and extend the line. This is the Median Line. [During deployment of median line ,you should consider that ,this line should cut the 50% retracement and inclined line of fibonacci at same point ]
Regards, hasten
If you don’t follow the stock market, you are missing some amazing drama.
| Description: |
|
| Filesize: |
36.44 KB |
| Viewed: |
689 Time(s) |
|
| Description: |
|
| Filesize: |
34.42 KB |
| Viewed: |
724 Time(s) |
|
|
|
| Back to top |
|
|
hasten
White Belt
Joined: 30 Jun 2011
Posts: 216
|
| Post: #5 Posted: Wed Jun 20, 2012 6:40 pm Post subject: |
|
|
STEP 4. Remove Fibonacci Retracement From chart .
Regards, hasten
If Your Trading Performance is Good, it's Only Because You Haven't Yet Made it Better!
| Description: |
|
| Filesize: |
30.7 KB |
| Viewed: |
652 Time(s) |
|
Last edited by hasten on Wed Jun 20, 2012 10:32 pm; edited 1 time in total |
|
| Back to top |
|
|
hasten
White Belt
Joined: 30 Jun 2011
Posts: 216
|
| Post: #6 Posted: Wed Jun 20, 2012 6:45 pm Post subject: |
|
|
STEP 5. Draw Trendline lines from P1 to P2.
Regards, hasten
Trading is easy, you don’t need nuthin fancy just buy when it’s going up and sell when it’s going down, that’s all there is to it.
| Description: |
|
| Filesize: |
33.72 KB |
| Viewed: |
710 Time(s) |
|
|
|
| Back to top |
|
|
sherbaaz
Yellow Belt

Joined: 27 May 2009
Posts: 543
|
| Post: #7 Posted: Wed Jun 20, 2012 6:48 pm Post subject: |
|
|
Here comes the basics and the logic. Else all is tukka.
Thanks a lot Hasten.
regds,
|
|
| Back to top |
|
|
hasten
White Belt
Joined: 30 Jun 2011
Posts: 216
|
| Post: #8 Posted: Wed Jun 20, 2012 7:15 pm Post subject: |
|
|
| svkum wrote: | HASTEN ,
I am happy that you are extending my idea further,by finetuning the process.[b][/b] |
Frankly speaking i am not fallowing pitchfork ,and i am posting under an obligation ,just because of u  ...........since 6 month i am getting many request for guiding Andrew's Pitchfork .... i was just avoiding those ......But after starting your thread peoples demanding to me to post at least one chart in a day .........and now they are asking me too much rambling questions .....like.....somebody post reliance chart whats your view? ...........what should we do in icici ?....... how to draw this ?........how to draw that ? ...........since 6 month i am getting many request for guiding Andrew's Pitchfork .... i was just avoiding those ......But after starting your thread peoples demanding to me to post at least one chart in a day .........and now they are asking me too much rambling questions .....like.....somebody post reliance chart whats your view? ...........what should we do in icici ?....... how to draw this ?........how to draw that ?
and now i am trap between all this.
Regards, hasten
Every dream has a price.
|
|
| Back to top |
|
|
hasten
White Belt
Joined: 30 Jun 2011
Posts: 216
|
| Post: #9 Posted: Wed Jun 20, 2012 7:18 pm Post subject: |
|
|
Andrews' Pitchfork is a trend channel tool consisting of three lines. The lines formed can help predict channels of support and resistance in a trending market.There is a median trendline in the center with two parallel equidistant trendlines on either side. Parallel Lines are drawn equidistant from the Median Line through the extreme pivots of the retracement swing(from P1 and P2) .[The outer parallel lines can then be placed at the upper and lower pivots to complete the set. ]
STEP 6. To drawing parallel line ( warning line ) ,draw a trendline over median line .
Regards, hasten
Kites rise highest against the wind, not with it.
| Description: |
|
| Filesize: |
41.22 KB |
| Viewed: |
696 Time(s) |
|
|
|
| Back to top |
|
|
hasten
White Belt
Joined: 30 Jun 2011
Posts: 216
|
| Post: #10 Posted: Wed Jun 20, 2012 7:25 pm Post subject: |
|
|
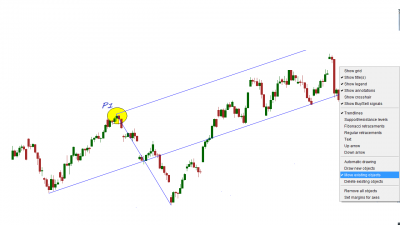
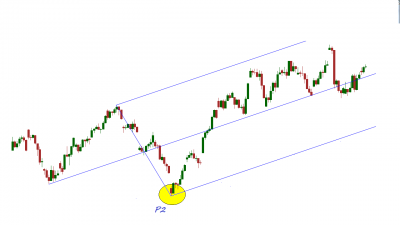
STEP 7. Move this trendline from median line to P1 (by selecting "move existing objects " in right click ).
Regards, hasten
The "what" (price action) is more important than the "why" (news, earnings, and so on).
| Description: |
|
| Filesize: |
63.23 KB |
| Viewed: |
734 Time(s) |
|
|
|
| Back to top |
|
|
hasten
White Belt
Joined: 30 Jun 2011
Posts: 216
|
| Post: #11 Posted: Wed Jun 20, 2012 7:32 pm Post subject: |
|
|
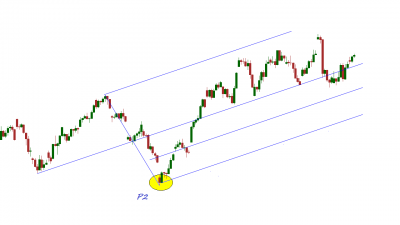
STEP 8. To draw lower parallel line ,do the same that we have done in the last step ,draw a trendline over median line and move it to P2 .
Regards, hasten
Don’t let the outcome of one trade alter your trading discipline. One trade doesn’t make a system..
| Description: |
|
| Filesize: |
53.33 KB |
| Viewed: |
710 Time(s) |
|
| Description: |
|
| Filesize: |
54.34 KB |
| Viewed: |
661 Time(s) |
|
| Description: |
|
| Filesize: |
45.62 KB |
| Viewed: |
704 Time(s) |
|
Last edited by hasten on Sat Oct 13, 2012 10:53 pm; edited 1 time in total |
|
| Back to top |
|
|
chetan83
Brown Belt

Joined: 19 Feb 2010
Posts: 2037
|
| Post: #12 Posted: Wed Jun 20, 2012 8:06 pm Post subject: |
|
|
Dear Hasten Ji,
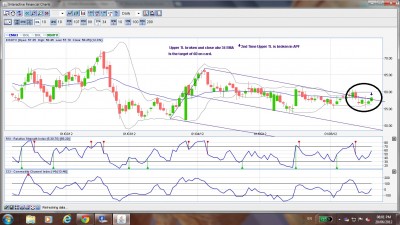
Going by your method, I tried drawing APF of DAILY DISH TV - 1M, hope you will rectify if there is any error.
Here the Upper TL is broken for the 2nd time, what can be the target here, as it is between the bolinger bands?
Pls enlighten.
Chetan.
| Description: |
|
| Filesize: |
298.25 KB |
| Viewed: |
793 Time(s) |
|
Last edited by chetan83 on Wed Jun 20, 2012 8:39 pm; edited 1 time in total |
|
| Back to top |
|
|
chiragbvyas
White Belt
Joined: 18 Feb 2010
Posts: 469
|
| Post: #13 Posted: Wed Jun 20, 2012 8:27 pm Post subject: |
|
|
| hasten wrote: | STEP 8. To draw upper parallel line ,do the same that we have done in the last step ,draw a trendline over median line and move it to P2 .
Regards, hasten
Don’t let the outcome of one trade alter your trading discipline. One trade doesn’t make a system.. |
Dear Hasten ji,
really very educative post.
heartly thankful to you
Regards
chirag...
|
|
| Back to top |
|
|
hasten
White Belt
Joined: 30 Jun 2011
Posts: 216
|
| Post: #14 Posted: Wed Jun 20, 2012 9:40 pm Post subject: |
|
|
| chetan83 wrote: | Dear Hasten Ji,
Going by your method, I tried drawing APF of DAILY DISH TV - 1M, hope you will rectify if there is any error.
Here the Upper TL is broken for the 2nd time, what can be the target here, as it is between the bolinger bands?
Pls enlighten.
Chetan. |
Please Don't post any chart here for that we have different thread (APF method ) ,I have started this thread just to educate how to draw Pitchfork properly . Keep this thread on silent .
Regards, hasten
Price is the ultimate indicator. Everything else is secondary.
|
|
| Back to top |
|
|
svkum
White Belt
Joined: 14 Feb 2007
Posts: 321
|
| Post: #15 Posted: Wed Jun 20, 2012 11:13 pm Post subject: |
|
|
hasten ,
step by step process explained by you is very clear , leaving no doughts.
There shd not be any problem in the mind of followers of APF , in practicing the same .
good job hasten.( you have really obliged me , w/o even my request)
|
|
| Back to top |
|
|
|


