| View previous topic :: View next topic |
| Author |
How to trade using iCharts Levels - C T Ramesh Raja Method |
chetan83
Brown Belt

Joined: 19 Feb 2010
Posts: 2037
|
Post: #76  Posted: Fri Jul 20, 2012 10:02 am Post subject: Posted: Fri Jul 20, 2012 10:02 am Post subject: |
 |
|
| BNF failed to enter in buy mode even in S1 price.....it moved down below S2.....
|
|
| Back to top |
|
 |
|
|
|
rameshraja
Expert

Joined: 24 Nov 2006
Posts: 1121
|
| Post: #77 Posted: Fri Jul 20, 2012 10:12 am Post subject: |
|
|
NF broke weekly LOC at 5238 and crashed to 5207 as of now in less than 60 minutes. Yesterday I mentioned here that it should not break weekly LOC>
Great Short below 5238 !!
|
|
| Back to top |
|
|
chetan83
Brown Belt
Joined: 19 Feb 2010
Posts: 2037
|
| Post: #78 Posted: Fri Jul 20, 2012 10:30 am Post subject: |
|
|
| vinay28 wrote: | dear ramesh raja
when you say NF is not supposed to break weekly LOC of 5238.10, which time frame are you talking about or is it instantaneous? |
Weekly LOC should be equal in all the TF...... 
|
|
| Back to top |
|
|
vinay28
Black Belt

Joined: 24 Dec 2010
Posts: 11748
|
| Post: #79 Posted: Fri Jul 20, 2012 10:58 am Post subject: |
|
|
| thanks chetan
|
|
| Back to top |
|
|
arnav2007
White Belt

Joined: 29 Jun 2009
Posts: 46
|
| Post: #80 Posted: Sat Jul 21, 2012 12:32 pm Post subject: |
|
|
Dear RR sir
attached filtered imperfect bullish/bearish close for all F&O shares
arnav
| arnav2007 wrote: | Dear R.Raja sir
Kindly look at the excel sheet attached herewith for scanning for imperfect bullish and bearish candle
here candle closed in red are considered for finding whether it was imperfect bearish or not. same with green candle for finding whether it was imperfect bullish close or not.
Kindly tell is it right ?
arnav
| rameshraja wrote: | Formula for Imperfect close:
IMPERFECT CLOSE IN BEARISH CANDLE:
On 25th June, Nifty has made imperfect close in Black candle. The OHLC of the day:
5148.90 5202.90 5098.20 5109.30
Formula : ( HIGH minus OPEN) – OPEN
(5202.90 – 5148.90)-5148.90 = 5094.30
For a perfect close, it should have closed below 5094.30, whereas it has closed at 5109.30. when it closes like this, then its termed as Imperfect Close in Bearish Candle.
IMPERFECT CLOSE IN BULLISH CANDLE :
On 31st May, Nifty has made imperfect close in Bullish Candle. The OHLC of the day:
4900.00 4926.55 4880.20 4916.25
Formula : ( OPEN minus LOW) + Open
(4900 – 4880.20) + 4900 = 4919.80
For a perfect close, it should have closed above 4919.80, whereas it has closed at 4916.25. When it closes like this, then its termed as Imperfect Close in Bullish Candle |
|
| Description: |
|

Download |
| Filename: |
Imperfect Close F&O Stocks.xls |
| Filesize: |
107.5 KB |
| Downloaded: |
761 Time(s) |
|
|
| Back to top |
|
|
vinay28
Black Belt
Joined: 24 Dec 2010
Posts: 11748
|
| Post: #81 Posted: Sun Jul 22, 2012 4:33 pm Post subject: |
|
|
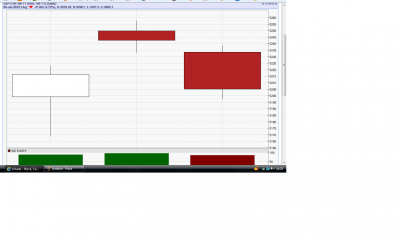
Dear Mr. RR
I am attaching a chart showing the last 3 day candles. They look like forming a perfect evening star if looked at in isolation. But this formation is at the end of a downtrend so I am not sure it can be called an evening star. Unless you wish to treat first candle as an uptrend which is "nipped in the bud".
Vinay
P.S. - the illustration showed by you does not show a gapped up second candle (star or doji star), which is, as I understand, a mandatory condition.
| Description: |
|
| Filesize: |
75.95 KB |
| Viewed: |
542 Time(s) |
|
|
|
| Back to top |
|
|
rameshraja
Expert
Joined: 24 Nov 2006
Posts: 1121
|
| Post: #82 Posted: Sun Jul 22, 2012 5:57 pm Post subject: |
|
|
Mr Vinay
You are saying this formation is in downtrend, whereas I feel market has overdone in its upmove of 600 points too fast with weak fundamentals. I am viewing this pattern seriously as I am waiting for shorting opporutnity.
C T R
|
|
| Back to top |
|
|
vinay28
Black Belt
Joined: 24 Dec 2010
Posts: 11748
|
| Post: #83 Posted: Sun Jul 22, 2012 7:48 pm Post subject: |
|
|
Dear RR, I am saying it is at the end of a down trend because it is, however small it may be. Don't we have to see any such a formation in the context of the trend immediately prior to it? Otherwise there would no end to it e.g. one can say we are in an uptrend since 2001. No offence meant to you at all by this.
I would go further RR. W.r.t. my post in ST's thread, even if market goes down from here as you say and it may.....afterall it is the king, it would not make this an evening star.
|
|
| Back to top |
|
|
rameshraja
Expert
Joined: 24 Nov 2006
Posts: 1121
|
| Post: #84 Posted: Sun Jul 22, 2012 8:35 pm Post subject: |
|
|
Mr Vinay
There are few points I would like to mention here.
I think you have not understood my writing in ST's thread. ST has opined likelyhood of market becoming weak from Option sentiment indicator. To my little bit of understanding of candlestick patterns, I assumed last Friday's candle stick completed Evening Star formation which supports option sentiment indication.
I may be wrong in interpretation of Candlestick patterns as I am not expert like TV people or GURU as you mentioned in ST's thread,( your quote: After seeing RR's post, I called my friend to discuss my logic with him on this issue. He too agreed that it was "not at all" an evening star. He is the one who has taught most of the experts who come on TV.) but definitely can understand whether the market current trend is in upward/downward in relation to time.
One final point I would like to mention here.. You may not be aware of this fact.. I was the first to give a call for Nifty to be bought at 920 in the year 2003 for Target of 6200 and to short from thereon for a crash of market to 1800 level. The entire move of Nifty is explained in shout box well in advance and entire transcript is still in icharts Forum under market direction. And market honoured my level of 6200 and crashed from 6357 to 2250 in 2008.
I emphasied the above point, since I wanted to clear you doubts if I am capable of understanding the trend.
C T R
|
|
| Back to top |
|
|
vinay28
Black Belt
Joined: 24 Dec 2010
Posts: 11748
|
| Post: #85 Posted: Sun Jul 22, 2012 9:13 pm Post subject: |
|
|
Dear RR
Just for clarification, please be rest assured that I don't have the slightest doubt about your capabilities in understanding the trend or in anything for that matter. If I do have any doubt, it is always about my capabilites.
I was just responding to your post about evening star and not about future trend. I won't do so in future since you doubt my intentions.
|
|
| Back to top |
|
|
rameshraja
Expert
Joined: 24 Nov 2006
Posts: 1121
|
| Post: #86 Posted: Sun Jul 22, 2012 9:25 pm Post subject: |
|
|
Dear Mr Vinay
Please correct your thinking.. I never doubted your intentions.. I am not expert in stock market which I keep repeating quite frequently. I only tried to emphasis that TV experts don't suggest to short or long near termination of trends..
No offence meant and you are free to do constructive criticisim of my analysis, and that could further enhance my knowledge in technicals.
Best Wishes
C T R
|
|
| Back to top |
|
|
mitu tyagi
White Belt
Joined: 31 Mar 2009
Posts: 7
|
| Post: #87 Posted: Thu Sep 06, 2012 4:04 pm Post subject: Use of Weekly levels |
|
|
| rameshraja wrote: | NF broke weekly LOC at 5238 and crashed to 5207 as of now in less than 60 minutes. Yesterday I mentioned here that it should not break weekly LOC>
Great Short below 5238 !! |
Sir, How to utilise weekly levels my understanding so far is as follows:
1) Weekly Loc should not break for continuation of trend, break would mean reversal.
2) If the price has pierced loc from bear side then it is likely to move up with momentum
3) If the price broke loc from bull side then crash landing is possible.
I wish to know how to utilize r1/s1 etc. or they be ignored
Also what should be the sl if weekly level is being traded.
Any other guidance that you would like to give for Weekly Levels.
|
|
| Back to top |
|
|
rameshraja
Expert
Joined: 24 Nov 2006
Posts: 1121
|
| Post: #88 Posted: Thu Sep 06, 2012 7:28 pm Post subject: |
|
|
Hello Mitu tyagi
You have not understood the system correctly.
Rules as follows:
For Long, BULL + 20 and SL is LOC
For Short Bear - minus 20 and SL is LOC
If above condition is meant, and if SL is takenout, the counter trend will have momentum.
Example:
1. Current week LT crossed BULL + 20 and became long. Subsequently, it broke LOC yesterday at 1351.50 and today stock crashed to 1314.
2.Current Week Infy breached Bear minus 20 and it was short.. when it crossed LOC today at 2386.85, it blasted to 2439.
Hope this meets your requirement.
Good Luck !!
C T RAMESH RAJA
|
|
| Back to top |
|
|
bhasha
White Belt
Joined: 11 Nov 2010
Posts: 6
|
| Post: #89 Posted: Fri Sep 07, 2012 9:36 am Post subject: |
|
|
| rameshraja wrote: | Mr Vinay
There are few points I would like to mention here.
I think you have not understood my writing in ST's thread. ST has opined likelyhood of market becoming weak from Option sentiment indicator. To my little bit of understanding of candlestick patterns, I assumed last Friday's candle stick completed Evening Star formation which supports option sentiment indication.
I may be wrong in interpretation of Candlestick patterns as I am not expert like TV people or GURU as you mentioned in ST's thread,( your quote: After seeing RR's post, I called my friend to discuss my logic with him on this issue. He too agreed that it was "not at all" an evening star. He is the one who has taught most of the experts who come on TV.) but definitely can understand whether the market current trend is in upward/downward in relation to time.
One final point I would like to mention here.. You may not be aware of this fact.. I was the first to give a call for Nifty to be bought at 920 in the year 2003 for Target of 6200 and to short from thereon for a crash of market to 1800 level. The entire move of Nifty is explained in shout box well in advance and entire transcript is still in icharts Forum under market direction. And market honoured my level of 6200 and crashed from 6357 to 2250 in 2008.
I emphasied the above point, since I wanted to clear you doubts if I am capable of understanding the trend.
C T R |
Ramesh ji,
I could not stop myself asking this question -
As per your vast experience, what is your feeling right now about Indian market? where are we headed?
you are not in obligation to answer this question but curious to know.
It may help somebody to take informed decision about thier investments in the market, including me 
awaiting for your opinion on the market.
Sorry Admins for posting unrelated question in this thread.
Just thought of asking Ramesh ji if he has any long term view on this market now.
|
|
| Back to top |
|
|
skd2012
Yellow Belt

Joined: 03 Oct 2012
Posts: 948
|
| Post: #90 Posted: Thu Nov 22, 2012 7:53 am Post subject: |
|
|
| Good method. Real jackpot is hidden in this.
|
|
| Back to top |
|
|
|


