| View previous topic :: View next topic |
| Author |
Importance of EMA 17 (Weekly) |
ConMan
White Belt

Joined: 06 Aug 2008
Posts: 344
|
|
| Back to top |
|
 |
|
| |
hansraj456
White Belt
Joined: 17 Nov 2009
Posts: 370
|
Post: #2  Posted: Sun Jan 17, 2010 6:17 am Post subject: Posted: Sun Jan 17, 2010 6:17 am Post subject: |
 |
|
Hi QGM
It works in a similar manner with 89 ema on daily charts. I use 89 ema to assess long term trend of nifty.
|
|
| Back to top |
|
|
RAJASIMHAN
White Belt
Joined: 15 Mar 2009
Posts: 13
|
| Post: #3 Posted: Sun Jan 17, 2010 7:55 am Post subject: |
|
|
Hi QGM,
Can we take position on Nifty-1M based on this EMA.
|
|
| Back to top |
|
|
Ravi_S
Yellow Belt

Joined: 15 Jun 2009
Posts: 569
|
| Post: #4 Posted: Sun Jan 17, 2010 8:46 pm Post subject: Re: Importance of EMA 17 (Weekly) |
|
|
QGM
It should be 11 - 15 weeks I think and not 11 - 15 days...
Regards
Ravi
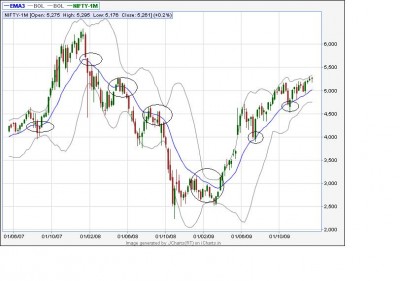
| QuickGMurugun wrote: | Dear All
Observed an interesting thing on Nifty-1m Weekly.
Nifty travels all the way towards EMA 17 once in between 11-15 days. This can help us give idea on the trend.
Hope this makes sense.
QGM  |
|
|
| Back to top |
|
|
ConMan
White Belt
Joined: 06 Aug 2008
Posts: 344
|
| Post: #5 Posted: Sun Jan 17, 2010 10:39 pm Post subject: |
|
|
Ravi
True....11-15 weeks....we can try the same on daily as well....lemme check 89 EMA
QGM
|
|
| Back to top |
|
|
ConMan
White Belt
Joined: 06 Aug 2008
Posts: 344
|
| Post: #6 Posted: Sun Jan 17, 2010 10:41 pm Post subject: |
|
|
Rajasimhan
This is definately a good trend indicator and can help you in taking positions...combine the same with any other momentum based indicator
QGM
|
|
| Back to top |
|
|
sandew
White Belt
Joined: 02 Feb 2009
Posts: 174
|
| Post: #7 Posted: Mon Jan 18, 2010 10:30 am Post subject: |
|
|
17 ema on weekly corresponds to 85 ema on daily (17 times 5 trading days).
Has anyone checked whether 16 week is more better or 18. Beyond that we are repeating Bollinger Band standard 20,2 set-up.
Still, a Thank You for the insight.
|
|
| Back to top |
|
|
|
|
You cannot post new topics in this forum
You cannot reply to topics in this forum
You cannot edit your posts in this forum
You cannot delete your posts in this forum
You cannot vote in polls in this forum
You can attach files in this forum
You can download files in this forum
|
Powered by phpBB © 2001, 2005 phpBB Group
|
|