| View previous topic :: View next topic |
| Author |
Index Futures |
vinay28
Black Belt

Joined: 24 Dec 2010
Posts: 11748
|
Post: #16  Posted: Tue May 15, 2012 11:00 am Post subject: Posted: Tue May 15, 2012 11:00 am Post subject: |
 |
|
| actually NF closed even below that with a heavy discount. That's because they couldn't cover their position when NS started going up. That's why they opened lower today to enable covering. You may seen a spike in first min when NF went up from 4870 to 4897 in a sec
|
|
| Back to top |
|
 |
|
|
 |
pkholla
Black Belt

Joined: 04 Nov 2010
Posts: 2890
|
Post: #17  Posted: Tue May 15, 2012 11:46 am Post subject: Posted: Tue May 15, 2012 11:46 am Post subject: |
 |
|
| Vinay: thnx both for reply & for trouble taken! Rgds, Prakash Holla
|
|
| Back to top |
|
 |
sherbaaz
Yellow Belt

Joined: 27 May 2009
Posts: 543
|
Post: #18  Posted: Tue May 22, 2012 5:38 pm Post subject: Posted: Tue May 22, 2012 5:38 pm Post subject: |
 |
|
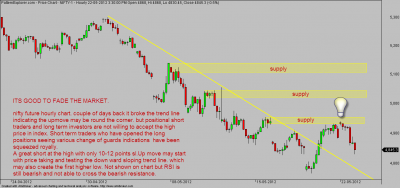
nifty future hourly chart.
regds,
| Description: |
|
| Filesize: |
51.35 KB |
| Viewed: |
565 Time(s) |
|
|
|
| Back to top |
|
 |
GHAISAS
White Belt

Joined: 01 Feb 2010
Posts: 349
|
Post: #19  Posted: Tue May 22, 2012 9:35 pm Post subject: Posted: Tue May 22, 2012 9:35 pm Post subject: |
 |
|
SHERBAAZ,
thanks for the picturesque detail. as well "royal squeeze".
ghaisas.
|
|
| Back to top |
|
 |
sherbaaz
Yellow Belt

Joined: 27 May 2009
Posts: 543
|
Post: #20  Posted: Wed May 23, 2012 10:12 am Post subject: Posted: Wed May 23, 2012 10:12 am Post subject: |
 |
|
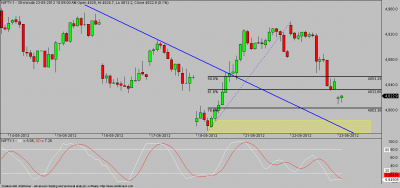
below is the chart of nifty future 30 min one can look to go long at current levels as sl is not very huge either in futures or buy 4800 ce current month use any oscialltor to confirm bullish crossover for which i am wating to happen to go long. it seems it may start w.3 as w.2 may have completed. aggressive trade.
another long oppo is at the demand zone in yellow shade or test of trend line
regds,
| Description: |
|
| Filesize: |
18.08 KB |
| Viewed: |
513 Time(s) |
|
|
|
| Back to top |
|
 |
sherbaaz
Yellow Belt

Joined: 27 May 2009
Posts: 543
|
Post: #21  Posted: Wed May 23, 2012 3:35 pm Post subject: Posted: Wed May 23, 2012 3:35 pm Post subject: |
 |
|
| sherbaaz wrote: | below is the chart of nifty future 30 min one can look to go long at current levels as sl is not very huge either in futures or buy 4800 ce current month use any oscialltor to confirm bullish crossover for which i am wating to happen to go long. it seems it may start w.3 as w.2 may have completed. aggressive trade.
another long oppo is at the demand zone in yellow shade or test of trend line
regds, |
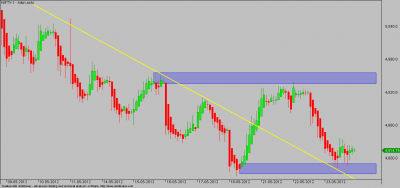
long opportunity happened to be at the test of down ward sloping trend line into the demand zone. Bought 4800 CE @ 65 and holding partial position in it.
multi time frames support and demand zone is there viz hourly and eod at the 30 min demand zone.
still the trend is down but short term traders may again try to take the price above 4900 if it happens 4935-4955 would be significant supply zone.
Whether long term investors/ positional shorts will accept the high price and support the trend change efforts of short term trade time will only tell?
below is the chart of 30 min tf.
regds,
| Description: |
|
| Filesize: |
11.84 KB |
| Viewed: |
488 Time(s) |
|
|
|
| Back to top |
|
 |
GHAISAS
White Belt

Joined: 01 Feb 2010
Posts: 349
|
Post: #22  Posted: Wed May 23, 2012 6:45 pm Post subject: Posted: Wed May 23, 2012 6:45 pm Post subject: |
 |
|
thanks for the education. current chart in hikin ashi and the earlier in candlesticks created confusion. kind regards,
ghaisas.
|
|
| Back to top |
|
 |
sherbaaz
Yellow Belt

Joined: 27 May 2009
Posts: 543
|
Post: #23  Posted: Thu May 24, 2012 3:40 pm Post subject: Posted: Thu May 24, 2012 3:40 pm Post subject: |
 |
|
| sherbaaz wrote: | | sherbaaz wrote: | below is the chart of nifty future 30 min one can look to go long at current levels as sl is not very huge either in futures or buy 4800 ce current month use any oscialltor to confirm bullish crossover for which i am wating to happen to go long. it seems it may start w.3 as w.2 may have completed. aggressive trade.
another long oppo is at the demand zone in yellow shade or test of trend line
regds, |
long opportunity happened to be at the test of down ward sloping trend line into the demand zone. Bought 4800 CE @ 65 and holding partial position in it.
multi time frames support and demand zone is there viz hourly and eod at the 30 min demand zone.
still the trend is down but short term traders may again try to take the price above 4900 if it happens 4935-4955 would be significant supply zone.
Whether long term investors/ positional shorts will accept the high price and support the trend change efforts of short term trade time will only tell?
below is the chart of 30 min tf.
regds, |
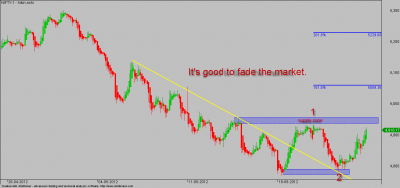
Short term traders have finally moved the price on the up side Also i think the same has been supported by positional short traders by liquidating shorts and also by long term investors. Price acceptance was there @ the high of the day.
good profit in 4800 CE as per expectations nifty moved up after meeting a strong demand zone yday. 4800 CE made the high of 142. 20. Nifty more than +2%.
on hourly and 30 min chart nifty may have entered in w.3 today tgts for w.3 is 5059-5229 if its turns out to be an extended w.3 thn it can go much higher.
the resistance @ the supply zone 4935-4956 is still intact. But I think tomorrow we may see a gap up opening above this zone trapping those who are shorts and having stop losses in this zone.
attached is the chart of 30 Min tf.
Regds,
| Description: |
|
| Filesize: |
30.42 KB |
| Viewed: |
512 Time(s) |
|
|
|
| Back to top |
|
 |
vinay28
Black Belt

Joined: 24 Dec 2010
Posts: 11748
|
Post: #24  Posted: Thu May 24, 2012 4:22 pm Post subject: Posted: Thu May 24, 2012 4:22 pm Post subject: |
 |
|
| execellent call sherbaaz!
|
|
| Back to top |
|
 |
sherbaaz
Yellow Belt

Joined: 27 May 2009
Posts: 543
|
Post: #25  Posted: Thu Dec 06, 2012 6:05 pm Post subject: Posted: Thu Dec 06, 2012 6:05 pm Post subject: |
 |
|
Hi all,
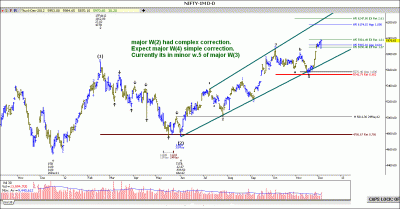
Attached is the chart of NF EOD with EW count.
Currently it seems we are in minor w.5 of major W.3.
Regds,
| Description: |
|
| Filesize: |
28 KB |
| Viewed: |
534 Time(s) |
|
|
|
| Back to top |
|
 |
p_wangdu
White Belt

Joined: 30 Apr 2012
Posts: 126
|
Post: #26  Posted: Thu Dec 06, 2012 7:38 pm Post subject: Posted: Thu Dec 06, 2012 7:38 pm Post subject: |
 |
|
| sherbaaz wrote: | Hi all,
Attached is the chart of NF EOD with EW count.
Currently it seems we are in minor w.5 of major W.3.
Regds, |
 thanks thanks
|
|
| Back to top |
|
 |
vinay28
Black Belt

Joined: 24 Dec 2010
Posts: 11748
|
Post: #27  Posted: Thu Dec 06, 2012 8:00 pm Post subject: Posted: Thu Dec 06, 2012 8:00 pm Post subject: |
 |
|
p_wangdu
if I remember right, wasn't it you only who had posted months ago that we will see 6200+?
|
|
| Back to top |
|
 |
saumya12
Brown Belt

Joined: 21 Dec 2011
Posts: 1509
|
Post: #28  Posted: Fri Dec 07, 2012 10:45 am Post subject: Posted: Fri Dec 07, 2012 10:45 am Post subject: |
 |
|
| Thanks for the chart and explanation.
|
|
| Back to top |
|
 |
sherbaaz
Yellow Belt

Joined: 27 May 2009
Posts: 543
|
Post: #29  Posted: Thu Apr 11, 2013 2:59 pm Post subject: Posted: Thu Apr 11, 2013 2:59 pm Post subject: |
 |
|
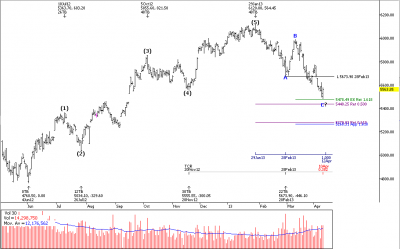
nifty future eod chart. seems like abc correction is over. price'ld trade above 5673.90 for first confirmation.
regds
| Description: |
|
| Filesize: |
18.18 KB |
| Viewed: |
511 Time(s) |
|
|
|
| Back to top |
|
 |
bharatpatel
White Belt

Joined: 26 Oct 2011
Posts: 401
|
Post: #30  Posted: Thu Apr 11, 2013 3:31 pm Post subject: Posted: Thu Apr 11, 2013 3:31 pm Post subject: |
 |
|
| sherbaaz wrote: | nifty future eod chart. seems like abc correction is over. price'ld trade above 5673.90 for first confirmation.
regds |
Warm Wel Come....
After such a long time.
Keep it up......
|
|
| Back to top |
|
 |
|

