| View previous topic :: View next topic |
| Author |
Index Futures |
sherbaaz
Yellow Belt

Joined: 27 May 2009
Posts: 543
|
Post: #46  Posted: Fri Jun 07, 2013 12:13 pm Post subject: Posted: Fri Jun 07, 2013 12:13 pm Post subject: |
 |
|
| sherbaaz wrote: | attached is the chart of nifty future eod.
it looks like that major W.1 is over. currently major W.2 correction is going on. w.a and w.b of this correction seems to be over and around 6120 w.c has started.
this w. c and major W.2 may get terminated around 5859-5869, there is strong support around these levels and major W.3 may start (min tgt will be 100% of major W.1).
regds, |
W.3 may have started as price is trading above the W.A. its a first confirmation.
second confirmation may come when price exceeds 6131.
yday and today 15-30 min tf provided an excellent opportunity to go long.
regds,
|
|
| Back to top |
|
 |
|
|
 |
chandrujimrc
Brown Belt

Joined: 21 Apr 2009
Posts: 1683
|
Post: #47  Posted: Fri Jun 07, 2013 9:04 pm Post subject: Posted: Fri Jun 07, 2013 9:04 pm Post subject: |
 |
|
Dear sherbaaz,
your current opinion about Nifty pl.
|
|
| Back to top |
|
 |
vsgokhale
White Belt

Joined: 24 Jul 2007
Posts: 18
|
Post: #48  Posted: Sun Jun 09, 2013 7:01 pm Post subject: Posted: Sun Jun 09, 2013 7:01 pm Post subject: |
 |
|
DEAR SHERBAAZ
Your view for this week NF & BNF pl. 
|
|
| Back to top |
|
 |
sherbaaz
Yellow Belt

Joined: 27 May 2009
Posts: 543
|
Post: #49  Posted: Sun Jun 09, 2013 10:34 pm Post subject: Posted: Sun Jun 09, 2013 10:34 pm Post subject: |
 |
|
dear vsgokhale & chandrujimrc,
i dont know what is going to happen next weak or even on next bar.
i simply follow system if its say buy then buy, sell then sell.
regds,
|
|
| Back to top |
|
 |
sherbaaz
Yellow Belt

Joined: 27 May 2009
Posts: 543
|
Post: #50  Posted: Tue Jun 11, 2013 11:43 am Post subject: Posted: Tue Jun 11, 2013 11:43 am Post subject: |
 |
|
stop loss triggered.
will enter long on next opportunity.
regds
|
|
| Back to top |
|
 |
sherbaaz
Yellow Belt

Joined: 27 May 2009
Posts: 543
|
Post: #51  Posted: Mon Jul 08, 2013 11:56 am Post subject: Posted: Mon Jul 08, 2013 11:56 am Post subject: |
 |
|
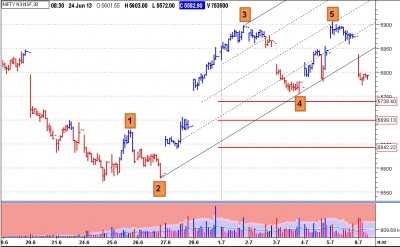
attached is the nf intraday 30M chart its seems like correction is going on after completion of five waves ew count on the upside. 5738-5699-5642 could be the tgts for correction.
regds,
| Description: |
|
| Filesize: |
311.38 KB |
| Viewed: |
449 Time(s) |
|
|
|
| Back to top |
|
 |
ajit602
White Belt

Joined: 11 Sep 2012
Posts: 370
|
Post: #52  Posted: Fri Aug 02, 2013 9:38 am Post subject: Posted: Fri Aug 02, 2013 9:38 am Post subject: |
 |
|
nifty spot levels
Sell Below Buy Above
5717.00 5783.00
TGT-1 5684.00 5816.00 TGT-1
TGT-2 5651.00 5849.00 TGT-2
TGT-3 5618.00 5882.00 TGT-3
|
|
| Back to top |
|
 |
sherbaaz
Yellow Belt

Joined: 27 May 2009
Posts: 543
|
Post: #53  Posted: Fri Aug 02, 2013 9:59 am Post subject: Posted: Fri Aug 02, 2013 9:59 am Post subject: |
 |
|
| ajit602 wrote: | nifty spot levels
Sell Below Buy Above
5717.00 5783.00
TGT-1 5684.00 5816.00 TGT-1
TGT-2 5651.00 5849.00 TGT-2
TGT-3 5618.00 5882.00 TGT-3 |
kindly start your own thread and delete the above, if it ok with you.
regds,
|
|
| Back to top |
|
 |
sherbaaz
Yellow Belt

Joined: 27 May 2009
Posts: 543
|
Post: #54  Posted: Fri Aug 23, 2013 7:41 pm Post subject: Posted: Fri Aug 23, 2013 7:41 pm Post subject: |
 |
|
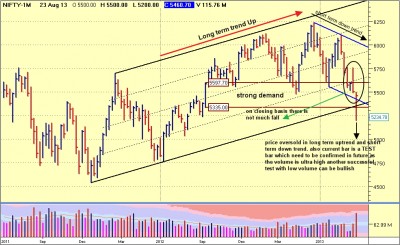
attached is the chart of weekly nifty future.
long term trend - UP
short term trend - DOWN.
Price- Oversold in long and short term trend. it tested the strong demand between 5597-5335. Wait for further SOS.
If break the long term up trend channel on the down side and fail to get inside it in coming weeks then long term uptrend will change to down side.
regds,
| Description: |
|
| Filesize: |
473.09 KB |
| Viewed: |
462 Time(s) |
|
|
|
| Back to top |
|
 |
vinay28
Black Belt

Joined: 24 Dec 2010
Posts: 11748
|
Post: #55  Posted: Fri Aug 23, 2013 7:49 pm Post subject: Posted: Fri Aug 23, 2013 7:49 pm Post subject: |
 |
|
| what will change short term trend to UP?
|
|
| Back to top |
|
 |
sherbaaz
Yellow Belt

Joined: 27 May 2009
Posts: 543
|
Post: #56  Posted: Mon Sep 02, 2013 6:48 pm Post subject: Posted: Mon Sep 02, 2013 6:48 pm Post subject: |
 |
|
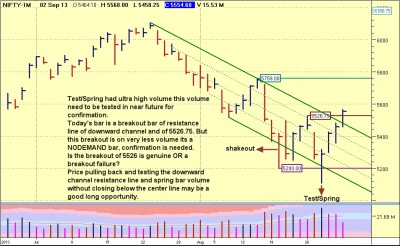
attached is the EOD chart of nifty future.
regds,
| Description: |
|
| Filesize: |
439.45 KB |
| Viewed: |
485 Time(s) |
|
|
|
| Back to top |
|
 |
sherbaaz
Yellow Belt

Joined: 27 May 2009
Posts: 543
|
Post: #57  Posted: Tue Sep 03, 2013 10:28 am Post subject: Posted: Tue Sep 03, 2013 10:28 am Post subject: |
 |
|
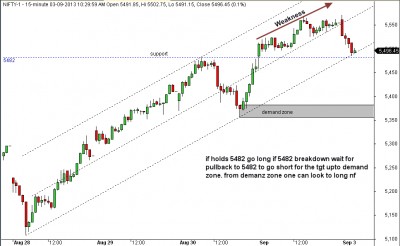
nifty M15 chart.
regds,
| Description: |
|
| Filesize: |
207.21 KB |
| Viewed: |
460 Time(s) |
|
|
|
| Back to top |
|
 |
bharatpatel
White Belt

Joined: 26 Oct 2011
Posts: 401
|
Post: #58  Posted: Tue Sep 03, 2013 12:32 pm Post subject: HI Posted: Tue Sep 03, 2013 12:32 pm Post subject: HI |
 |
|
| sherbaaz wrote: | nifty M15 chart.
regds, |
Good Analysis.
|
|
| Back to top |
|
 |
sherbaaz
Yellow Belt

Joined: 27 May 2009
Posts: 543
|
Post: #59  Posted: Tue Sep 03, 2013 1:05 pm Post subject: Posted: Tue Sep 03, 2013 1:05 pm Post subject: |
 |
|
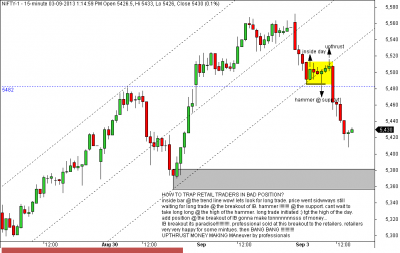
How to trap retail traders in bad positions
| Description: |
|
| Filesize: |
21.17 KB |
| Viewed: |
477 Time(s) |
|
|
|
| Back to top |
|
 |
sherbaaz
Yellow Belt

Joined: 27 May 2009
Posts: 543
|
Post: #60  Posted: Tue Sep 03, 2013 1:41 pm Post subject: Posted: Tue Sep 03, 2013 1:41 pm Post subject: |
 |
|
| sherbaaz wrote: | nifty M15 chart.
regds, |
price close to demand zone. in hourly its inside the demand zone.
|
|
| Back to top |
|
 |
|

