| View previous topic :: View next topic |
| Author |
Index Futures |
Andre
White Belt

Joined: 06 Jun 2012
Posts: 220
|
Post: #61  Posted: Tue Sep 03, 2013 1:47 pm Post subject: Posted: Tue Sep 03, 2013 1:47 pm Post subject: |
 |
|
Sherbaaz....
what would be stoploss for this trade in nifty.....
Low of the red candle i.e. 5356....please guide us....
Regards,
Andre
| sherbaaz wrote: | | sherbaaz wrote: | nifty M15 chart.
regds, |
price close to demand zone. in hourly its inside the demand zone. |
|
|
| Back to top |
|
 |
|
|
 |
sherbaaz
Yellow Belt

Joined: 27 May 2009
Posts: 543
|
Post: #62  Posted: Tue Sep 03, 2013 1:52 pm Post subject: Posted: Tue Sep 03, 2013 1:52 pm Post subject: |
 |
|
| Andre wrote: | Sherbaaz....
what would be stoploss for this trade in nifty.....
Low of the red candle i.e. 5356....please guide us....
Regards,
Andre
|
trade as per your method. i am just indicating high probability zone.
|
|
| Back to top |
|
 |
sherbaaz
Yellow Belt

Joined: 27 May 2009
Posts: 543
|
Post: #63  Posted: Wed Sep 04, 2013 10:11 am Post subject: Posted: Wed Sep 04, 2013 10:11 am Post subject: |
 |
|
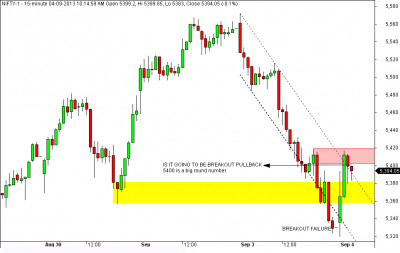
NIFTY M15 chart
| Description: |
|
| Filesize: |
16.06 KB |
| Viewed: |
481 Time(s) |
|
|
|
| Back to top |
|
 |
sherbaaz
Yellow Belt

Joined: 27 May 2009
Posts: 543
|
Post: #64  Posted: Wed Sep 04, 2013 11:10 am Post subject: Posted: Wed Sep 04, 2013 11:10 am Post subject: |
 |
|
| sherbaaz wrote: | | NIFTY M15 chart |
nifty rocking M3 has inverted hns with a tgt of 5500.
The only fundamental factor that really counts in the stock market is The Law of Supply and Demand.
|
|
| Back to top |
|
 |
sherbaaz
Yellow Belt

Joined: 27 May 2009
Posts: 543
|
Post: #65  Posted: Wed Sep 04, 2013 1:44 pm Post subject: Posted: Wed Sep 04, 2013 1:44 pm Post subject: |
 |
|
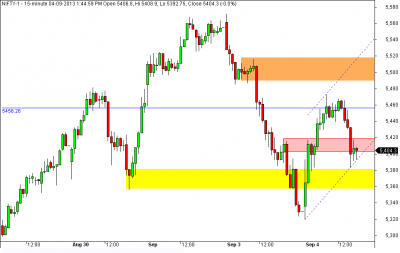
nifty M15 chart price is at the edge. good buy with very low sl.
Livermore once said to me: “ I go long or short as close as I can to the danger point, and if the danger becomes real I close out and take a small loss-Wyckoff.”
| Description: |
|
| Filesize: |
15.18 KB |
| Viewed: |
494 Time(s) |
|
|
|
| Back to top |
|
 |
sherbaaz
Yellow Belt

Joined: 27 May 2009
Posts: 543
|
Post: #66  Posted: Wed Sep 04, 2013 7:12 pm Post subject: Posted: Wed Sep 04, 2013 7:12 pm Post subject: |
 |
|
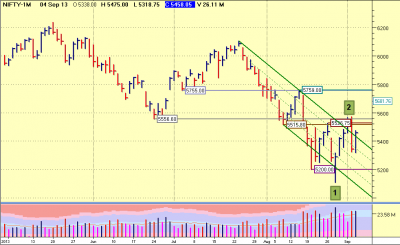
attached is the EOD chart of NF. today again price close above the resistance line of downward channel.
it looks like price is forming 1-2-3 low set up. if completed by the breakout of point 2 it indicates trend reversal. BUT there is strong supply zone between 5556-5515.
huge volume is coming on lower levels in fact the volume of last few days if compare is highest to many weeks and months.
currently it looks like that breakout of the supply zone (if happens) and pull back to it or test of it may be a good long entry. REST depends on how price unfolds in coming days.
If insiders traded like outsiders the insiders would soon be outsiders.
| Description: |
|
| Filesize: |
24.29 KB |
| Viewed: |
481 Time(s) |
|
|
|
| Back to top |
|
 |
amitagg
Black Belt

Joined: 01 Oct 2013
Posts: 4559
|
Post: #67  Posted: Wed Sep 04, 2013 7:51 pm Post subject: Posted: Wed Sep 04, 2013 7:51 pm Post subject: |
 |
|
Sherbaaz, with your seemingly great chart reading of "inside" behaviour, pls confirm or rebut or modify the following
- 3 pushes down are complete
- the restest of low is apparently successful with todays low not below yesterdays low
- the daily candle close today is above the last red candle high of 5440 (don't recall 5 min or 15 min TF)
- the time to buy is not on watch of break of 5515 or 5555 but 5475 I guess..
- if tomorrow close is in green then we have 2 High bars (signalling early buy opportunity as per al brooks price action)
- given that there is already asmall trendline break on upside in chart below
- one can "easily" buy tomorrow on 5 mins holding 5470-5475 line (if it happens) for "very high proBability targets" of 5515-5550 (in fact 5620 should be aimed now since 5550 has been tested)
- see also (not drawn on your chart) that the upside is forming a channel also with 5620 being immediate target
- all depends on 1 hour or so price action tomorrow and whether NS sustains above 5475
- shall confirm to "inside behaviour" as well to break past 5550 to show "bullishness" and end it past 5600-5650.(This is abstract surmise conjecture only)
|
|
| Back to top |
|
 |
sherbaaz
Yellow Belt

Joined: 27 May 2009
Posts: 543
|
Post: #68  Posted: Wed Sep 04, 2013 8:18 pm Post subject: Posted: Wed Sep 04, 2013 8:18 pm Post subject: |
 |
|
| amitagg wrote: |
- 3 pushes down are complete |
I dont know what are 3 pushes down are? are u referring to three downswing in this trend?
| amitagg wrote: |
- the restest of low is apparently successful with todays low not below yesterdays low |
today's low was below yday low today's low-5318.75 yday's low-5323.20. but yes you are right in saying that there is a successful test of yday's low on intra chart.
| amitagg wrote: |
- the daily candle close today is above the last red candle high of 5440 (don't recall 5 min or 15 min TF) |
it has no meaning to me.
| amitagg wrote: |
- the time to buy is not on watch of break of 5515 or 5555 but 5475 I guess.. |
well for me on EOD trend is still down, there looks like trend reversal may happen as there is 1-2-3 low forming. those who bought @ the breakout of channel yday and day before yday must had triggered their sl and may be in good losses. i need more confirmation to go long on EOD. these may come in different forms, one by way of breakout of point 2 after 1-2-3 low formation(if it happen) and there are many other ways also which we come to know as price unfolds in coming days.
| amitagg wrote: |
- if tomorrow close is in green then we have 2 High bars (signalling early buy opportunity as per al brooks price action) |
dont know anyting about al brooks so cant comment. there is nothing like early or late buy. buy/sell must be as per your system be it buying at the bottom or at the breakout of some top.
| amitagg wrote: |
- given that there is already asmall trendline break on upside in chart below |
if you are saying about the breakout of the downward trend line of downward channel then this breakout has no meaning for me. price may shoot from here to the upside, price may come down or price may go sideways, I dont know its still not at the buy place for me. may be for you as per your system.
| amitagg wrote: |
- one can "easily" buy tomorrow on 5 mins holding 5470-5475 line (if it happens) for "very high proBability targets" of 5515-5550 (in fact 5620 should be aimed now since 5550 has been tested) |
if your systems says so buy it. again for me its wait and watch.
| amitagg wrote: |
- see also (not drawn on your chart) that the upside is forming a channel also with 5620 being immediate target |
its not a valid trend channel which your are referring to. there are not enough bars to draw it
| amitagg wrote: |
- all depends on 1 hour or so price action tomorrow and whether NS sustains above 5475 |
i dont know
Three men came to Wall Street. The first always knew what was the best buy. The second knew why it was best to buy. But the third knew neither of these things; he only knew when to buy. He made the most money.
regds,
|
|
| Back to top |
|
 |
amitagg
Black Belt

Joined: 01 Oct 2013
Posts: 4559
|
Post: #69  Posted: Wed Sep 04, 2013 9:01 pm Post subject: Posted: Wed Sep 04, 2013 9:01 pm Post subject: |
 |
|
| Thanks for the point wise elucidation. Appreciate it. But shall try to learn over time the "when" question.pls keep posting thanks
|
|
| Back to top |
|
 |
arvindeept
White Belt

Joined: 25 Jun 2012
Posts: 107
|
Post: #70  Posted: Wed Sep 04, 2013 9:40 pm Post subject: Posted: Wed Sep 04, 2013 9:40 pm Post subject: |
 |
|
| sherbaaz wrote: | attached is the EOD chart of NF. today again price close above the resistance line of downward channel.
it looks like price is forming 1-2-3 low set up. if completed by the breakout of point 2 it indicates trend reversal. BUT there is strong supply zone between 5556-5515.
huge volume is coming on lower levels in fact the volume of last few days if compare is highest to many weeks and months.
currently it looks like that breakout of the supply zone (if happens) and pull back to it or test of it may be a good long entry. REST depends on how price unfolds in coming days.
If insiders traded like outsiders the insiders would soon be outsiders. |
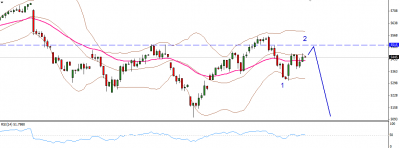
Just a contra view
| Description: |
|
| Filesize: |
25.03 KB |
| Viewed: |
477 Time(s) |
|
|
|
| Back to top |
|
 |
chandrujimrc
Brown Belt

Joined: 21 Apr 2009
Posts: 1683
|
Post: #71  Posted: Wed Sep 04, 2013 9:48 pm Post subject: Posted: Wed Sep 04, 2013 9:48 pm Post subject: |
 |
|
Dear sherbaaz,
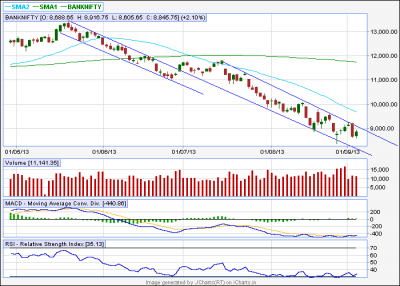
Continuity of Bank nifty falling wedge,your view pl.
| Description: |
|
| Filesize: |
12.65 KB |
| Viewed: |
451 Time(s) |
|
|
|
| Back to top |
|
 |
sherbaaz
Yellow Belt

Joined: 27 May 2009
Posts: 543
|
Post: #72  Posted: Wed Sep 04, 2013 10:17 pm Post subject: Posted: Wed Sep 04, 2013 10:17 pm Post subject: |
 |
|
| chandrujimrc wrote: | Dear sherbaaz,
Continuity of Bank nifty falling wedge,your view pl. |
hi,
i dont trade banknifty. EOD dont have any idea but on weekly it looks like that there is a demand zone 8465-7750.
Do not operate for the sake of making trades, but only for the purpose of making money.
regds,
|
|
| Back to top |
|
 |
sherbaaz
Yellow Belt

Joined: 27 May 2009
Posts: 543
|
Post: #73  Posted: Thu Sep 05, 2013 11:24 am Post subject: Posted: Thu Sep 05, 2013 11:24 am Post subject: |
 |
|
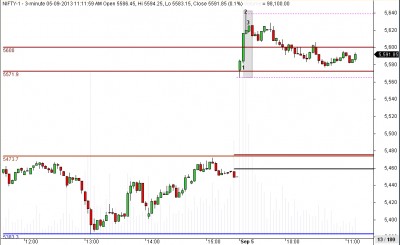
attached is the M3 chart of nifty future. highlighted area on chart has 3 candles viz. 1, 2 and 3.
these 3 candles in combination along with volume showing huge selling or off loading has happened at the high (till now of the day).
bar 1 looks like a breakout bar of 5600 on huge volume. bar 2 is a shooting star, a money making maneuver by hitting sl's of those who shorted keeping sl above the high of bar 1. bar 3 is a bearish harami pattern along with volume its is suggesting there is lack of demand and its difficult for price to go up having lack of demand.
long trade should be considered above the high of the day as off now, if bar 1 is real breakout bar then absorption is going on.
short trade should be considered below the low of the day as off now if bars 1,2 & 3 consist of selling.
Trading in Stocks is an ideal business when you know how to operate scientifically.
| Description: |
|
| Filesize: |
179.69 KB |
| Viewed: |
499 Time(s) |
|
|
|
| Back to top |
|
 |
amitagg
Black Belt

Joined: 01 Oct 2013
Posts: 4559
|
Post: #74  Posted: Thu Sep 05, 2013 1:37 pm Post subject: Posted: Thu Sep 05, 2013 1:37 pm Post subject: |
 |
|
| thanks. what levels should be target. on both sides..[obvously thinks can change later on when the break do happen and even afterwards to modify hte targets/ SL]
|
|
| Back to top |
|
 |
chandrujimrc
Brown Belt

Joined: 21 Apr 2009
Posts: 1683
|
Post: #75  Posted: Thu Sep 05, 2013 2:01 pm Post subject: Posted: Thu Sep 05, 2013 2:01 pm Post subject: |
 |
|
| Thank you sherbaaz.
|
|
| Back to top |
|
 |
|

