| View previous topic :: View next topic |
| Author |
Index Futures |
sherbaaz
Yellow Belt

Joined: 27 May 2009
Posts: 543
|
Post: #1  Posted: Fri Mar 02, 2012 11:43 am Post subject: Index Futures Posted: Fri Mar 02, 2012 11:43 am Post subject: Index Futures |
 |
|
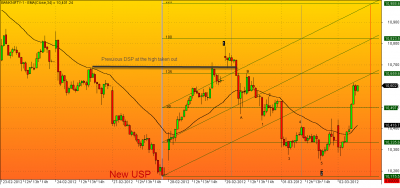
Attached is the chart of BNF 15M. I have been trying to align spec method along with elliott wave for some time. Its working on most of the time. still lots of fine tuning need to be done.
Bnf after breaking the last DSP completed W.1 and corrective W.2. As off now its moving after bullish rejection. It seems to be W.3 an impulse wave. Currently facing resistance at gann angle. once crossed W.B of W.2 there is a high probability bnf making new recovery high as its W.3 it has to cross high of W.1
Regards,
| Description: |
|
| Filesize: |
36.7 KB |
| Viewed: |
575 Time(s) |
|
Last edited by sherbaaz on Wed Mar 21, 2012 1:45 pm; edited 1 time in total |
|
| Back to top |
|
 |
|
|
 |
rkarora59
White Belt

Joined: 21 Feb 2012
Posts: 1
|
Post: #2  Posted: Fri Mar 02, 2012 1:16 pm Post subject: Bank Nifty Posted: Fri Mar 02, 2012 1:16 pm Post subject: Bank Nifty |
 |
|
Dear Sherbaaz,
Volatility in Bank Nifty, on the basis of last 10 days EOD data, is 57.80. Gann levels show best performance only when volatility is above 20 and below 40.Above 40 Elliot Wave gives best result. Bank Nifty has moved, 15 mins charts, from 10250(W2) to 10675. As per Fib.theory it can retrace to 0.382% of 425pts and will get support near 10513.Treat it as a corrective wave of impulse wave 3 and it will complete its journey for its normal target of 11152 and can extend to 11397.
|
|
| Back to top |
|
 |
sherbaaz
Yellow Belt

Joined: 27 May 2009
Posts: 543
|
Post: #3  Posted: Fri Mar 02, 2012 1:30 pm Post subject: Re: Bank Nifty Posted: Fri Mar 02, 2012 1:30 pm Post subject: Re: Bank Nifty |
 |
|
| rkarora59 wrote: | Dear Sherbaaz,
Volatility in Bank Nifty, on the basis of last 10 days EOD data, is 57.80. Gann levels show best performance only when volatility is above 20 and below 40.Above 40 Elliot Wave gives best result. Bank Nifty has moved, 15 mins charts, from 10250(W2) to 10675. As per Fib.theory it can retrace to 0.382% of 425pts and will get support near 10513.Treat it as a corrective wave of impulse wave 3 and it will complete its journey for its normal target of 11152 and can extend to 11397. |
Mr. rkarora59,
Thanks for your comment and inputs I will try to look into them. My attempt is not from pure ew point of view.
I am trying to align certain things. Yes on EOD basis you are very right. But that is not the TF i trade.
Thanks once again for your inputs keep posting.
Regards,
|
|
| Back to top |
|
 |
sherbaaz
Yellow Belt

Joined: 27 May 2009
Posts: 543
|
Post: #4  Posted: Sat Mar 03, 2012 2:52 pm Post subject: Re: Bank Nifty Posted: Sat Mar 03, 2012 2:52 pm Post subject: Re: Bank Nifty |
 |
|
| sherbaaz wrote: | Attached is the chart of BNF 15M. I have been trying to align spec method along with elliott wave for some time. Its working on most of the time. still lots of fine tuning need to be done.
Bnf after breaking the last DSP completed W.1 and corrective W.2. As off now its moving after bullish rejection. It seems to be W.3 an impulse wave. Currently facing resistance at gann angle. once crossed W.B of W.2 there is a high probability bnf making new recovery high as its W.3 it has to cross high of W.1
Regards, |
Date: 3-3-12
Ticker bnf
tf: 15M
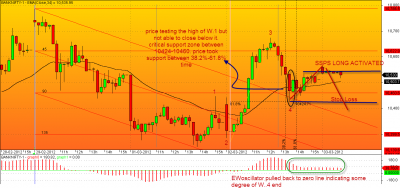
In continuation of my post below is the chart attached. It looks like bnf is in W.4. today although there was no action on price front but as per ssps long has been initiated @ 10540 sl 10424 or below it.
Yday on 02-03-12 after sharp upmove which was W.3 higher degree W.3 bnf retraced back and took support in very critical zone. between 10424-10460(90 degree). support was provided by gann horizontal line and angle price went below both but candle was not able to close below both.
the pull back i think may be W.4 price and time both are confirming time wise its between 38.2% to 61.8% candle took support and the low is still intact.
Also EW oscillator has pulled back near to zero line at the time price tested the above support zone indicating some degree of w.4 is over.
on the flip side it may be an ABC correction in W.4 in that case A and B are formed and C will make a new low below A OR a complex correction. Let see how it pen's out on Monday.
Regards,
| Description: |
|
| Filesize: |
71.78 KB |
| Viewed: |
510 Time(s) |
|
|
|
| Back to top |
|
 |
rvg
White Belt

Joined: 31 Oct 2006
Posts: 279
|
Post: #5  Posted: Sat Mar 03, 2012 5:57 pm Post subject: EWOscillator Posted: Sat Mar 03, 2012 5:57 pm Post subject: EWOscillator |
 |
|
| Sherbaaz - Thanks.. Can you please highlight what is EWOscillator ; is it a proprietary indicator ?
|
|
| Back to top |
|
 |
sherbaaz
Yellow Belt

Joined: 27 May 2009
Posts: 543
|
Post: #6  Posted: Sat Mar 03, 2012 6:29 pm Post subject: Re: EWOscillator Posted: Sat Mar 03, 2012 6:29 pm Post subject: Re: EWOscillator |
 |
|
| rvg wrote: | | Sherbaaz - Thanks.. Can you please highlight what is EWOscillator ; is it a proprietary indicator ? |
Hi rvg.
No EWOscillator is not the prop indicator. It basically a 5-34 oscillator which you can duplicate in macd by changing the parameters to 5-34-5. in platinum its there as an EW oscillator.
it basically helps in supporting wave counts.mainly in identifying end of w.4 and end of w.5.
originally it was invented by thomas joseph who made Aget as per my knowledge. He uses two bands also above and below zeroline which helps in identifying beginning of W.3 mainly. But what are the parameters or the formula of those bands i dont know as off now.
hope the above will solve yr query.
regds,
|
|
| Back to top |
|
 |
vinst
Black Belt

Joined: 09 Jan 2007
Posts: 3303
|
Post: #7  Posted: Sat Mar 03, 2012 6:46 pm Post subject: Re: EWOscillator Posted: Sat Mar 03, 2012 6:46 pm Post subject: Re: EWOscillator |
 |
|
| sherbaaz wrote: | | rvg wrote: | | Sherbaaz - Thanks.. Can you please highlight what is EWOscillator ; is it a proprietary indicator ? |
Hi rvg.
No EWOscillator is not the prop indicator. It basically a 5-34 oscillator which you can duplicate in macd by changing the parameters to 5-34-5. in platinum its there as an EW oscillator.
it basically helps in supporting wave counts.mainly in identifying end of w.4 and end of w.5.
originally it was invented by thomas joseph who made Aget as per my knowledge. He uses two bands also above and below zeroline which helps in identifying beginning of W.3 mainly. But what are the parameters or the formula of those bands i dont know as off now.
hope the above will solve yr query.
regds, |
the bands are based on 80% max and min of the EWosc. But what's the lookback period for finding max and min, I do not know.
|
|
| Back to top |
|
 |
sherbaaz
Yellow Belt

Joined: 27 May 2009
Posts: 543
|
Post: #8  Posted: Wed Mar 21, 2012 1:48 pm Post subject: Posted: Wed Mar 21, 2012 1:48 pm Post subject: |
 |
|
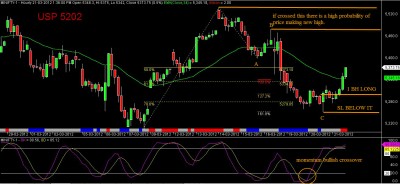
Attached is the hourly chart of MNF. It looks like that it has completed ABC correction and moving UP. USP is 5202.
The current correction is either W.B OR W.2 If its W.2 that means major W.3 has started and a very big up move may be expected.
Rest of the markings are on chart.
Regds,
| Description: |
|
| Filesize: |
214.73 KB |
| Viewed: |
518 Time(s) |
|
|
|
| Back to top |
|
 |
sherbaaz
Yellow Belt

Joined: 27 May 2009
Posts: 543
|
Post: #9  Posted: Mon Apr 30, 2012 10:10 am Post subject: Posted: Mon Apr 30, 2012 10:10 am Post subject: |
 |
|
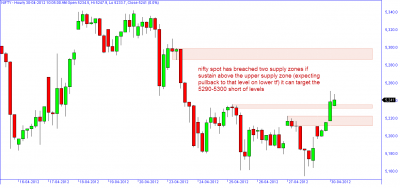
Attached is the hourly chart of NIFTY Spot.
Regds,
| Description: |
|
| Filesize: |
19.53 KB |
| Viewed: |
491 Time(s) |
|
|
|
| Back to top |
|
 |
sherbaaz
Yellow Belt

Joined: 27 May 2009
Posts: 543
|
Post: #10  Posted: Fri May 04, 2012 3:08 pm Post subject: Posted: Fri May 04, 2012 3:08 pm Post subject: |
 |
|
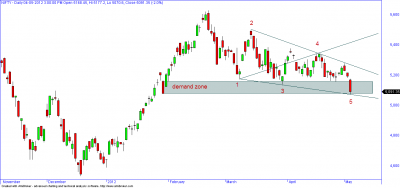
below is the chart of nifty spot with today's fall it has come into a demand zone although not a fresh demand zone but has provided good support earlier. if sustain this level an upside may be possible as there is also a bullish ww formation which may start.
regds,
| Description: |
|
| Filesize: |
14.89 KB |
| Viewed: |
496 Time(s) |
|
|
|
| Back to top |
|
 |
sherbaaz
Yellow Belt

Joined: 27 May 2009
Posts: 543
|
Post: #11  Posted: Thu May 10, 2012 1:56 pm Post subject: Posted: Thu May 10, 2012 1:56 pm Post subject: |
 |
|
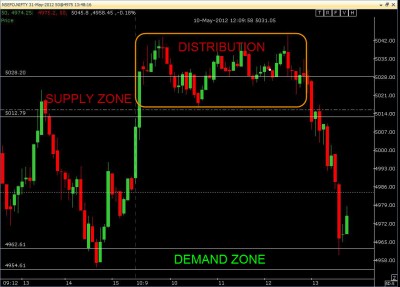
below is the nifty future 5 min chart of today with marked supply demand zone. Professional shaken off the retail traders opening higher and taking price above supply zone and after that a round of distribution done by them at high. and then price skid from day's high as off now it has already tested the demand zone.
whether price will sustain the demand zone or not?
regds
| Description: |
|
| Filesize: |
140.88 KB |
| Viewed: |
489 Time(s) |
|
|
|
| Back to top |
|
 |
bharatpatel
White Belt

Joined: 26 Oct 2011
Posts: 401
|
Post: #12  Posted: Thu May 10, 2012 5:50 pm Post subject: hi Posted: Thu May 10, 2012 5:50 pm Post subject: hi |
 |
|
Dear sherbaaz,
can u pls post the nifty (spot) chart with your view on it ?
Regards
Bharat
|
|
| Back to top |
|
 |
sherbaaz
Yellow Belt

Joined: 27 May 2009
Posts: 543
|
Post: #13  Posted: Thu May 10, 2012 8:20 pm Post subject: Re: hi Posted: Thu May 10, 2012 8:20 pm Post subject: Re: hi |
 |
|
| bharatpatel wrote: | Dear sherbaaz,
can u pls post the nifty (spot) chart with your view on it ?
Regards
Bharat |
hi,
what time frame chart you are int in.
regds,
|
|
| Back to top |
|
 |
sherbaaz
Yellow Belt

Joined: 27 May 2009
Posts: 543
|
Post: #14  Posted: Thu May 10, 2012 8:30 pm Post subject: Re: hi Posted: Thu May 10, 2012 8:30 pm Post subject: Re: hi |
 |
|
| sherbaaz wrote: | | bharatpatel wrote: | Dear sherbaaz,
can u pls post the nifty (spot) chart with your view on it ?
Regards
Bharat |
hi,
what time frame chart you are int in.
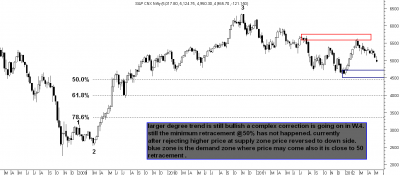
attaching weekly chart of nifty spot where things are looking pretty scary currently.
regds, |
| Description: |
|
| Filesize: |
27.56 KB |
| Viewed: |
526 Time(s) |
|
|
|
| Back to top |
|
 |
pkholla
Black Belt

Joined: 04 Nov 2010
Posts: 2890
|
Post: #15  Posted: Tue May 15, 2012 10:22 am Post subject: Posted: Tue May 15, 2012 10:22 am Post subject: |
 |
|
| Friends: Y'day (14-5-12) NS closed around 4908 and NF around 4888 ie 20 points below. Any significance OR due to gadbad since 1330? Prakash Holla
|
|
| Back to top |
|
 |
|

