| View previous topic :: View next topic |
| Author |
Individual Stocks |
riteshucha
Green Belt

Joined: 19 May 2012
Posts: 1292
|
Post: #4561  Posted: Tue Jul 01, 2014 4:27 pm Post subject: Posted: Tue Jul 01, 2014 4:27 pm Post subject: |
 |
|
manoj, not sure if the levels will work in individual stocks... lets see
SBIN
Buy At 2740.78. Target = 2759.96. Stoploss = 2718.8488
Sell At 2681.33. Target = 2662.56. Stoploss = 2702.7756
SBIN Furture anywys has formed an IB in todays trade..
for tomm u can see if it crosses today;s high / today;s low and subsequnt break of above levels for double confirmation and trade....
|
|
| Back to top |
|
 |
|
|
|
vinay28
Black Belt

Joined: 24 Dec 2010
Posts: 11748
|
| Post: #4562 Posted: Tue Jul 01, 2014 8:43 pm Post subject: |
|
|
| I am going to start buying veer energy (503657) tmrw which is listed only on bse. cmp about 6.0.
|
|
| Back to top |
|
|
manojrp
White Belt

Joined: 14 Mar 2012
Posts: 432
|
| Post: #4563 Posted: Tue Jul 01, 2014 9:19 pm Post subject: |
|
|
| riteshucha wrote: | manoj, not sure if the levels will work in individual stocks... lets see
SBIN
Buy At 2740.78. Target = 2759.96. Stoploss = 2718.8488
Sell At 2681.33. Target = 2662.56. Stoploss = 2702.7756
SBIN Furture anywys has formed an IB in todays trade..
for tomm u can see if it crosses today;s high / today;s low and subsequnt break of above levels for double confirmation and trade.... |
thanks ritesh lets see tomorrow
|
|
| Back to top |
|
|
amitagg
Black Belt
Joined: 01 Oct 2013
Posts: 4559
|
| Post: #4564 Posted: Tue Jul 01, 2014 9:26 pm Post subject: |
|
|
| vinay28 wrote: | | I am going to start buying veer energy (503657) tmrw which is listed only on bse. cmp about 6.0. |
noted and going with you....for small qtny...Sl immaterial....
|
|
| Back to top |
|
|
ragarwal
Yellow Belt

Joined: 16 Nov 2008
Posts: 582
|
| Post: #4565 Posted: Tue Jul 01, 2014 11:00 pm Post subject: |
|
|
| Thnx vinay.whats ur target fr veer in short as well as long term?
|
|
| Back to top |
|
|
vinay28
Black Belt
Joined: 24 Dec 2010
Posts: 11748
|
| Post: #4566 Posted: Wed Jul 02, 2014 7:45 am Post subject: |
|
|
| ragarwal wrote: | | Thnx vinay.whats ur target fr veer in short as well as long term? |
absolutely no idea. haven't studied it yet. just happened to see it accidentally. first I thought it's a scam but I am not convinced, considering that promoters still hold about 35% and it meets my "simple strategy for investment". of course it can easily go to about 4 quickly.
as amit said, no SL as of now.
|
|
| Back to top |
|
|
vinay28
Black Belt
Joined: 24 Dec 2010
Posts: 11748
|
| Post: #4567 Posted: Fri Jul 04, 2014 1:02 pm Post subject: |
|
|
| Shares that one can start buying slowly after about 10% correction below CMP - IDFC, Tata Power, Tata Chem and Bhel.
|
|
| Back to top |
|
|
riteshucha
Green Belt
Joined: 19 May 2012
Posts: 1292
|
| Post: #4568 Posted: Fri Jul 04, 2014 5:46 pm Post subject: |
|
|
| any idea on HDIL looking at today's candle...?
|
|
| Back to top |
|
|
apka
Black Belt
Joined: 13 Dec 2011
Posts: 6137
|
| Post: #4569 Posted: Sat Jul 05, 2014 11:05 pm Post subject: |
|
|
| apka wrote: | Amitgg, i have powergrid open taken at 99 at beginning of yr for trgt 160 by dec.. Yesterday it was at 123.
Asian paints trgt 580+ in 2 months. |
powergrid 145... few more points to go.
asian paints removed 503 -> 589.
|
|
| Back to top |
|
|
saumya12
Brown Belt

Joined: 21 Dec 2011
Posts: 1509
|
| Post: #4570 Posted: Sat Jul 05, 2014 11:24 pm Post subject: |
|
|
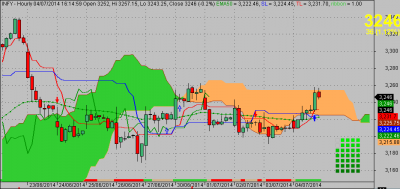
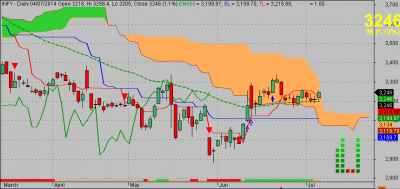
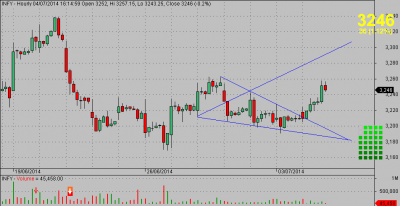
INFY
INFY +ww 30 min tf tgt 3305 4.7.14
INFY may reach around 3300 in next 1-2 trading sessions.
As per Ichimoku studies, Hourly chart indicates that once over 3255, it will be out of Kumo and may move up, while as per daily chart, in next trading session, INFY will be out of KUMO, by all means. 
| Description: |
|
| Filesize: |
28.82 KB |
| Viewed: |
221 Time(s) |
|
| Description: |
|
| Filesize: |
28.53 KB |
| Viewed: |
221 Time(s) |
|
| Description: |
|
| Filesize: |
24.92 KB |
| Viewed: |
224 Time(s) |
|
|
|
| Back to top |
|
|
deepu_1983
White Belt
Joined: 18 Feb 2014
Posts: 1
|
| Post: #4571 Posted: Mon Jul 07, 2014 1:31 pm Post subject: Reliance - Bullish Engulfing - 1 Month Chart |
|
|
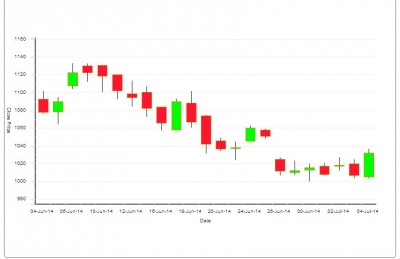
Reliance has made a bullish engulfing pattern on 4th July, 2014. This pattern has been formed near a support zone. The stock was, anyways, in an oversold region prior to this formation.
Hold Positionally with Stop Loss 1005 on the cash price. Immediate target 1045-1060 and above that 1090.
[/img]
| Description: |
|
| Filesize: |
32.86 KB |
| Viewed: |
220 Time(s) |
|
|
|
| Back to top |
|
|
saumya12
Brown Belt
Joined: 21 Dec 2011
Posts: 1509
|
| Post: #4572 Posted: Mon Jul 07, 2014 1:39 pm Post subject: |
|
|
| saumya12 wrote: | INFY
INFY +ww 30 min tf tgt 3305 4.7.14
INFY may reach around 3300 in next 1-2 trading sessions.
As per Ichimoku studies, Hourly chart indicates that once over 3255, it will be out of Kumo and may move up, while as per daily chart, in next trading session, INFY will be out of KUMO, by all means. |
|
|
| Back to top |
|
|
Ruchirgupta2000
White Belt
Joined: 12 Jun 2014
Posts: 297
|
| Post: #4573 Posted: Mon Jul 07, 2014 2:32 pm Post subject: |
|
|
Correction- "why they should NOT sell at oversold RSI and Stockastics."
| saumya12 wrote: | | saumya12 wrote: | INFY
INFY +ww 30 min tf tgt 3305 4.7.14
INFY may reach around 3300 in next 1-2 trading sessions.
As per Ichimoku studies, Hourly chart indicates that once over 3255, it will be out of Kumo and may move up, while as per daily chart, in next trading session, INFY will be out of KUMO, by all means. |
|
Hi Saumya, few more possitives to add-
Few more possitives
1. tenkensen and kejunsen are below the prices
2. chikao is also in open in both the cases
3. Hourly cloud is bullish, which daily cloud is yet to turn bullish.
I must paise you for learning ichimoku which is the most difficult and complicated ( Elliot wave also) which normally a person procrastinates to learn.
And once you start trading ichimoku or Elliot waves they can ealisy understand that why they should now sell at oversold RSI and Stockastics.
Great work keep it up..
Regards,
Ruchir 
|
|
| Back to top |
|
|
vinay28
Black Belt
Joined: 24 Dec 2010
Posts: 11748
|
| Post: #4574 Posted: Fri Jul 11, 2014 11:56 am Post subject: |
|
|
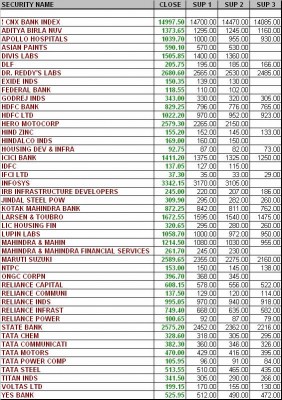
for those who are interested. Got it from a friend.
| Description: |
|
| Filesize: |
150.85 KB |
| Viewed: |
267 Time(s) |
|
|
|
| Back to top |
|
|
ragarwal
Yellow Belt
Joined: 16 Nov 2008
Posts: 582
|
| Post: #4575 Posted: Fri Jul 11, 2014 12:01 pm Post subject: |
|
|
| thanks vinay.ant stoploss for veer energy?
|
|
| Back to top |
|
|
|


