| View previous topic :: View next topic |
| Author |
Interesting Candlestick Patterns - EOD - for swing traders. |
rajshreed
White Belt

Joined: 25 Dec 2010
Posts: 8
|
Post: #16  Posted: Wed Jan 12, 2011 9:52 pm Post subject: Posted: Wed Jan 12, 2011 9:52 pm Post subject: |
 |
|
| sherbaaz wrote: | | casper wrote: | hiii brotherssssssssssss!!!!!!!!!!!!!!!!!!

whenever any body talks about candle stick, i just cant resist myself from uploading this ebook
its not mine, once i downloaded it from forum.
this is the 3 rd time i am uploading it
see if it helps any of u
 |
Hi,
this book would not help u much it may be use at most for quick ref nothing more in it. to understand candlesticks, understand the psyche behind the candles that will give u an insight into the mkt.
a hammer at every place for eg would not be off any use its position viz a vie over all chart is the thing u need to see. same goes with other patterns. there are many different ways u can use candlesticks in your existing systems and set up one for eg is divergence include candlesticks analysis in it and u will find a new dimension to your analysis and trade.
another eg i can quote and whih i use frequently if a hammer, hanging man or any other candle pattern rejection from a ema let say 34,20 any moving avg
add volume to candlesticks and you are GAME for sure.
for me if you know how to use candlesticks u need not to know any other thing.
regards, |
Hello Sherbazz,
As you have quoted rightly that u/s the psyche behind the candle sticks. but the books' gud to start of with as i donno anythin much..
So how to exactly go about u/s the psyche could you guide me in tht? (if possible) also could you kindly elaborate your eg.? 
Regards
Rajshree
|
|
| Back to top |
|
 |
|
|
|
amitkbaid1008
Yellow Belt

Joined: 04 Mar 2009
Posts: 540
|
| Post: #17 Posted: Wed Jan 12, 2011 10:00 pm Post subject: |
|
|
Candle Stick Patterns are very much HANDLE WITH CARE
So be careful while trading these patterns
|
|
| Back to top |
|
|
sherbaaz
Yellow Belt
Joined: 27 May 2009
Posts: 543
|
| Post: #18 Posted: Thu Jan 13, 2011 10:29 am Post subject: |
|
|
| rajshreed wrote: | | sherbaaz wrote: | | casper wrote: | hiii brotherssssssssssss!!!!!!!!!!!!!!!!!!
whenever any body talks about candle stick, i just cant resist myself from uploading this ebook
its not mine, once i downloaded it from forum.
this is the 3 rd time i am uploading it
see if it helps any of u
|
Hi,
this book would not help u much it may be use at most for quick ref nothing more in it. to understand candlesticks, understand the psyche behind the candles that will give u an insight into the mkt.
a hammer at every place for eg would not be off any use its position viz a vie over all chart is the thing u need to see. same goes with other patterns. there are many different ways u can use candlesticks in your existing systems and set up one for eg is divergence include candlesticks analysis in it and u will find a new dimension to your analysis and trade.
another eg i can quote and whih i use frequently if a hammer, hanging man or any other candle pattern rejection from a ema let say 34,20 any moving avg
add volume to candlesticks and you are GAME for sure.
for me if you know how to use candlesticks u need not to know any other thing.
regards, |
Hello Sherbazz,
As you have quoted rightly that u/s the psyche behind the candle sticks. but the books' gud to start of with as i donno anythin much..
So how to exactly go about u/s the psyche could you guide me in tht? (if possible) also could you kindly elaborate your eg.?
Regards
Rajshree |
Hi,
I have said book is good for reference. now the reason behind this is the book mainly deal with candlesticks patterns not candlesticks the system/chart.
most of us are int only in the patterns/set up is when start learning candlesticks they focus only on reversal signals hammer,hanging etc but not on candlesticks.
If you learn candlesticks as a whole which definitely includes reversal signals/pattern then you dont need any thing. candlesticks are more than sufficient.
now the Q comes who has the time to put such a tall effort and its really an effort to learn candlesticks as all of us are int in making money and that to QUICK money forget about money keep your approach right money will follow u. that's what i believe in.
as i suggested in one of earlier post read book by steve nison you yourself will find the diffence between his book approach and other books. keep the book attached by casper as ready reckoner but only use it for reference.
regards,
|
|
| Back to top |
|
|
rajshreed
White Belt
Joined: 25 Dec 2010
Posts: 8
|
| Post: #19 Posted: Thu Jan 13, 2011 8:17 pm Post subject: Book for candlesticks |
|
|
Hi,
Is the book you talked about before
"JAPANESE CANDLESTICK CHARTING
TECHNIQUES: A Contemporary Guide to the Ancient Investment Techniques of the Far East STEVE NISON"
Regards
|
|
| Back to top |
|
|
aromal
White Belt
Joined: 22 Mar 2010
Posts: 302
|
| Post: #20 Posted: Thu Jan 13, 2011 8:44 pm Post subject: Re: Book for candlesticks |
|
|
| rajshreed wrote: | Hi,
Is the book you talked about before
"JAPANESE CANDLESTICK CHARTING
TECHNIQUES: A Contemporary Guide to the Ancient Investment Techniques of the Far East STEVE NISON"
Regards |

|
|
| Back to top |
|
|
sherbaaz
Yellow Belt
Joined: 27 May 2009
Posts: 543
|
| Post: #21 Posted: Thu Jan 13, 2011 11:06 pm Post subject: Re: Book for candlesticks |
|
|
| rajshreed wrote: | Hi,
Is the book you talked about before
"JAPANESE CANDLESTICK CHARTING
TECHNIQUES: A Contemporary Guide to the Ancient Investment Techniques of the Far East STEVE NISON"
Regards |
ya
|
|
| Back to top |
|
|
Padkondu
White Belt
Joined: 23 Jan 2008
Posts: 120
|
| Post: #22 Posted: Fri Jan 14, 2011 8:24 pm Post subject: Re: Book for candlesticks |
|
|
| sherbaaz wrote: | | rajshreed wrote: | Hi,
Is the book you talked about before
"JAPANESE CANDLESTICK CHARTING
TECHNIQUES: A Contemporary Guide to the Ancient Investment Techniques of the Far East STEVE NISON"
Regards |
ya |
this is a great book on candlesticks, ofcourse those who are interested in candlesticks
|
|
| Back to top |
|
|
Padkondu
White Belt
Joined: 23 Jan 2008
Posts: 120
|
| Post: #23 Posted: Fri Jan 14, 2011 8:35 pm Post subject: |
|
|
| amitkbaid1008 wrote: | Candle Stick Patterns are very much HANDLE WITH CARE
So be careful while trading these patterns |
there are people who say "ignore indicators, they misguide you" and "technical analysis - it is a big waste of time" and so on. let me put forth my view. every part of technical analysis whether candlesticks or indicator based trading or any thing else for that matter, one will be able to understand only on experience. there are moments where every thing fails. failure is a part of technical analysis. there is no way we can say "it works 100% of times. you have to look for candles "where you have to look", it is not that "when ever you find a cs pattern it will work for you." ultimately, any thing works with more probability only with an enhanced analysis. technical analysis is not a 1+2 = 3 formula to give you an easy way to trade and so is the case with candles. but in my perception, if the higher timeframe trend is bullish, the bullish reversal patterns in lower time frame work most of the times, particularly hammer. and vice versa. i mean to say have the big picture before you get into micro level.
regards
padkondu
|
|
| Back to top |
|
|
casper
Green Belt

Joined: 02 Oct 2010
Posts: 1315
|
| Post: #24 Posted: Fri Jan 14, 2011 9:48 pm Post subject: |
|
|
| Padkondu wrote: | | amitkbaid1008 wrote: | Candle Stick Patterns are very much HANDLE WITH CARE
So be careful while trading these patterns |
there are people who say "ignore indicators, they misguide you" and "technical analysis - it is a big waste of time" and so on. let me put forth my view. every part of technical analysis whether candlesticks or indicator based trading or any thing else for that matter, one will be able to understand only on experience. there are moments where every thing fails. failure is a part of technical analysis. there is no way we can say "it works 100% of times. you have to look for candles "where you have to look", it is not that "when ever you find a cs pattern it will work for you." ultimately, any thing works with more probability only with an enhanced analysis. technical analysis is not a 1+2 = 3 formula to give you an easy way to trade and so is the case with candles. but in my perception, if the higher timeframe trend is bullish, the bullish reversal patterns in lower time frame work most of the times, particularly hammer. and vice versa. i mean to say have the big picture before you get into micro level.
regards
padkondu |
really nicely explained. i am so happy brother, u have explained the spirit of T.A, wish u more success in future

|
|
| Back to top |
|
|
Padkondu
White Belt
Joined: 23 Jan 2008
Posts: 120
|
| Post: #25 Posted: Wed Jan 26, 2011 7:04 pm Post subject: KFA Shooting Star |
|
|
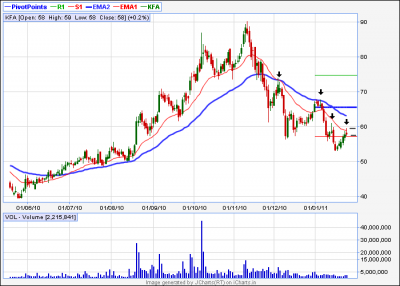
Hi friends,
KFA is forming a shooting starpattern after an up move for the last one week or so. the broad trend is down wards as given by 20+50 ema combination.
Shooting star:
this chart has the recent history/tendency of forming shooting stars at the top.
as required, the latest candle has a small real body, small lower wick and the upper wick is more than twice the real body. color of the candle is not important. only thing is that it did not form with increased volumes.
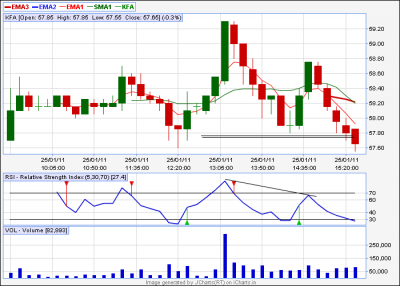
now let us get into the intra day action of this stock on 25/01/11.
the second chart gives the intra day action of the stock. though it is not necessary to go in to the intraday price action. this is an example of typical shooting star.
the opend gap up showing the bullishness as it was moving for the last week or so. then during the second half of the day, it wen in to the control of bears. look at the volumes during second half.
one can go short on the next day on close below the low of this candle, which is 58. with stop just above high of the candle which is 59. the probable target is 53, the most recent swing low. however on breach of 53 it could go to 49 which is the 161.8% retracement level of current up move.
regards
padkondu
| Description: |
| Look at the intraday action. all the bulls were neutralised and the stock went into the hands of bears during second half of the day. |
|
| Filesize: |
19.09 KB |
| Viewed: |
546 Time(s) |
|
| Description: |
| this is an eod chart. on 25th jan 11, KFA formed a nice shooting star pattern. |
|
| Filesize: |
17.41 KB |
| Viewed: |
527 Time(s) |
|
|
|
| Back to top |
|
|
Padkondu
White Belt
Joined: 23 Jan 2008
Posts: 120
|
| Post: #26 Posted: Wed Jan 26, 2011 7:15 pm Post subject: IOB Shooting Star Dly |
|
|
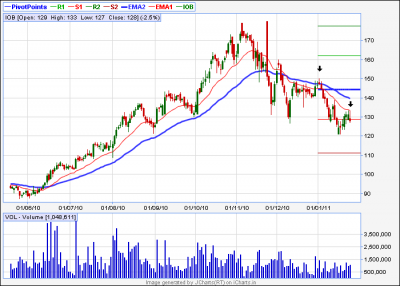
As with the KFA, IOB also formed nice shooring star pattern.
The big picture: down trend
Current move: bullish for the last week or so
Shooting star formed
short on close (just before the close of the market) of the candle below the low of the current shooting star with stop just above the high of the shooting star.
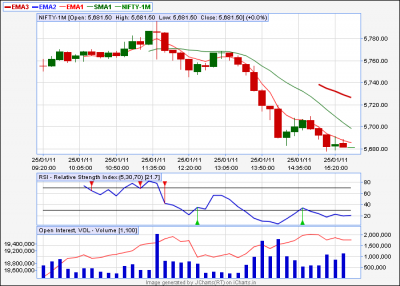
the stock closed almost at the bottom if we check the 10 min chart. but on eod chart it is shown as different since, the last 30 min moving average is considered for the closing price of a stock but not the actual LTP at closing. so practically there is no lower wick. and the upper wick is more than twice of the real body. boy is small as compared to the normal open close range of the stock.
regards
padkondu
| Description: |
| Shooting star on eod chart |
|
| Filesize: |
17.88 KB |
| Viewed: |
518 Time(s) |
|
| Description: |
| Intraday price action. just out of interest. |
|
| Filesize: |
21.5 KB |
| Viewed: |
511 Time(s) |
|
|
|
| Back to top |
|
|
Padkondu
White Belt
Joined: 23 Jan 2008
Posts: 120
|
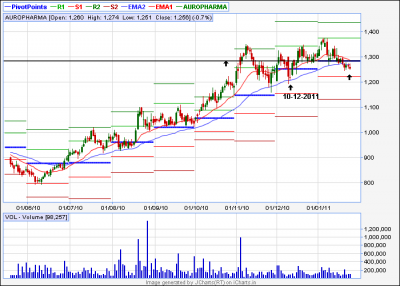
| Post: #27 Posted: Wed Jan 26, 2011 7:37 pm Post subject: AUROPHARMA - Inv Hammer |
|
|
dear friends.
Inverted hammer is a bullish reversal pattern and generally it is considered as a weak pattern.
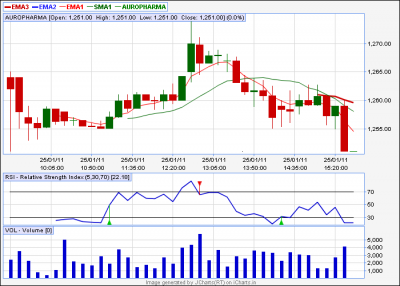
on 10-12-2011 it formed an inverted hammer. but the case is different from now. on 10th december, the stock was in up trend. the next day stock closed above the inverted hammer top and above pivot line and above the marubozu line of previous big bearish candle.
but now the stock went into short term down trend and below the pivot lane. so it may not work this time.
if we go into the intraday price action, the stock closed at the bottom and the second half of the day was controlled by bears. so it is not a bullish reversal pattern this time against the big picture.
however, if the stock closes above the pivot line with huge volumes the one can consider going long with the low of the entry candle as stop.
it is too far from possibility.
regards
padkondu
| Description: |
| Inverted hammer below 50 day ema, below monthly pivot. this pattern is not so strong to deal with this bearish ness |
|
| Filesize: |
17.02 KB |
| Viewed: |
596 Time(s) |
|
| Description: |
| Look at the intraday price action, how it went into the total control of bears |
|
| Filesize: |
18.56 KB |
| Viewed: |
527 Time(s) |
|
|
|
| Back to top |
|
|
Padkondu
White Belt
Joined: 23 Jan 2008
Posts: 120
|
| Post: #28 Posted: Wed Jan 26, 2011 7:59 pm Post subject: CS Patterns |
|
|
Hi friends
to day there are three posts. the basic idea behind these posts is pure education in this area of tech analysis. i am also not an expert. the openions here are not trading ideas. i invite the comments from experts on candlesticks.
regards
padkondu
|
|
| Back to top |
|
|
Padkondu
White Belt
Joined: 23 Jan 2008
Posts: 120
|
| Post: #29 Posted: Thu Jan 27, 2011 11:16 pm Post subject: KFA Shooting Star |
|
|
While IOB did not close below yesterdays low, KFA hasa closed below yesterdays low breaching the bottom of the shooting star. the auropharma, - inverted hammer - did not work as a reversal pattern , just as expected.
let us see what will happen to kfa
regards
padkondu
|
|
| Back to top |
|
|
Padkondu
White Belt
Joined: 23 Jan 2008
Posts: 120
|
| Post: #30 Posted: Sun Jan 30, 2011 11:57 pm Post subject: Some Information on candle sticks |
|
|
Hi freidns!
some of our friends have asked about the candle stick patterns and as such i am attaching two doc file which contains very useful information about candlestick patterns and methods to deal with candles etc. Please note that this is gathered from various sources, duly deleting unnecessary information.
regards
padkondu
| Description: |
| little advanced treatment of candles |
|

Download |
| Filename: |
Candlestick patterns. how to trade.doc |
| Filesize: |
682 KB |
| Downloaded: |
1058 Time(s) |
| Description: |
| basics on some important cs patterns |
|
Download |
| Filename: |
Candlestick Patterns.doc |
| Filesize: |
634.5 KB |
| Downloaded: |
1487 Time(s) |
|
|
| Back to top |
|
|
|


