| View previous topic :: View next topic |
| Author |
Interesting Candlestick Patterns - EOD - for swing traders. |
Padkondu
White Belt

Joined: 23 Jan 2008
Posts: 120
|
Post: #31  Posted: Fri Feb 04, 2011 9:15 am Post subject: Voltas hammer Posted: Fri Feb 04, 2011 9:15 am Post subject: Voltas hammer |
 |
|
Dear friends
in the previous posts i gave the charts of auro pharma, kfa and iob. i actually took short position in kfa futs, only since i am not a agressive trader. rather i am on my path to reaching a professional trader over a longer period of time. the kfa gave very good returns.
in my previous posts i said that you have to look at candlestick patterns where you have to look and they do not work where ever they apper.
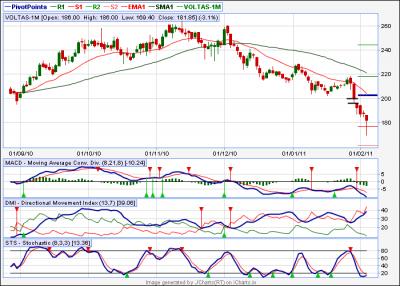
now we have a case of voltas forming hammer at the bottom on eod chart. there is no upper wick and the lower wick is more than the size of the of the real body. only cause of concern is that it is in a short term down trend. for every reversal patterns the ply is against the trend, so this statement that the stock is in a down trend has to be expalined better.
if the primary trend is up and there is a pullback and a hammer is formed. then it is most reliable. but this is a different case. here the primary trend (short term trend) as indicated by 20d ema and 50d ema shows a down trend. and the current move is also down. it is ideal in this case to look for a bearish reversal after an small upward move over 3-8 candles. (just as the case of kfa shown earlier.) the stock is over sold in daily chart (over sold condition in down trend is common and stocks continue to be over sold for longer period during down trend, we can only add it as say 5% evidence for upward move)
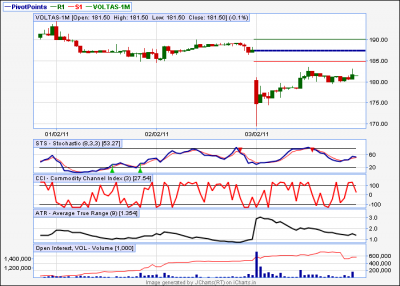
however on looking into the 15 min chart of the voltas, the entire day is in the control of bull and all the bears are capped.
now the idea is to go long above yester days high + 12.5% of the yester days range which works out to be 188. but immediately above this there is a wlky s1 at 162-164 rnage. so buying above 192 is ideal. whether this happens to day or tomarrow, one has to wait. this stock is currently moving with nifty. only general market conditions move this stock for now. but the stop is much lower and risk reward ratio is not good. the stock has mover far way from the 34 ema and ther could be a pull back on breach of 192-193. ther is a gap down, indicating bearish ness, doji indicating an indecision and now a hammer telling the possibility of reversal. but this could be only a short lived pull back in a down trend which will resume its trend short of our targts.
i personally stay away from this.
this post is only meant for education purpose only, rather how i analyse the stock.
as usal, i always seek the openion of my seniors. i express my openions in the forum not to teach some one, but to seek advice on my openions, which could inturn help some other beginners.
regards
padkondu.
| Description: |
| voltas eod chart with 20ema and 50 sma as short term trend indicator. |
|
| Filesize: |
36.76 KB |
| Viewed: |
511 Time(s) |

|
| Description: |
|
| Filesize: |
24.52 KB |
| Viewed: |
513 Time(s) |

|
|
|
| Back to top |
|
 |
|
|  |
|
|
You cannot post new topics in this forum
You cannot reply to topics in this forum
You cannot edit your posts in this forum
You cannot delete your posts in this forum
You cannot vote in polls in this forum
You can attach files in this forum
You can download files in this forum
|
Powered by phpBB © 2001, 2005 phpBB Group
|
|

