| View previous topic :: View next topic |
| Author |
Interesting Charts (I will try to post one each trading day) |
SwingTrader
Site Admin
Joined: 11 Aug 2006
Posts: 2903
Location: Hyderabad, India
|
Post: #11  Posted: Mon Sep 18, 2006 6:42 pm Post subject: Posted: Mon Sep 18, 2006 6:42 pm Post subject: |
 |
|
FINPIPE (pointed out by Vince) has very nice price action. The volume vs price action after the breakout & change of trend looks very good. Many powerful moves in it recently. I would jump into it on a small pullback. Not sure about Vince's trading style but many traders don't wait for a pullback in a strong stock because there might not be one until it moves much further up.
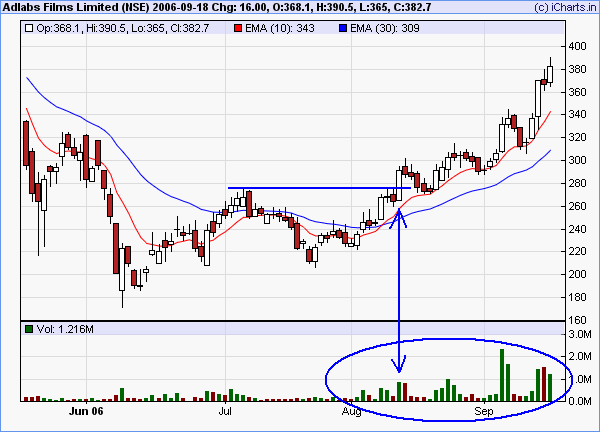
The price action in ADLABSFILM is very nice & steady. It had a decent breakout in early Aug and it has been moving very well after that. It is probably ready for a pullback. The next major resistance is between 440 & 450 and once it breaks thru' it will be off to races. That, of course, is my opinion. What happens ahead is what I am interested in watching too.
| Description: |
|
| Filesize: |
14.05 KB |
| Viewed: |
6915 Time(s) |
|
| Description: |
|
| Filesize: |
14.48 KB |
| Viewed: |
6914 Time(s) |
|
_________________
Srikanth Kurdukar
@SwingTrader |
|
| Back to top |
|
 |
|
|
|
SwingTrader
Site Admin
Joined: 11 Aug 2006
Posts: 2903
Location: Hyderabad, India
|
| Post: #12 Posted: Wed Sep 20, 2006 7:25 pm Post subject: IL & FS InvestSmart Ltd |
|
|
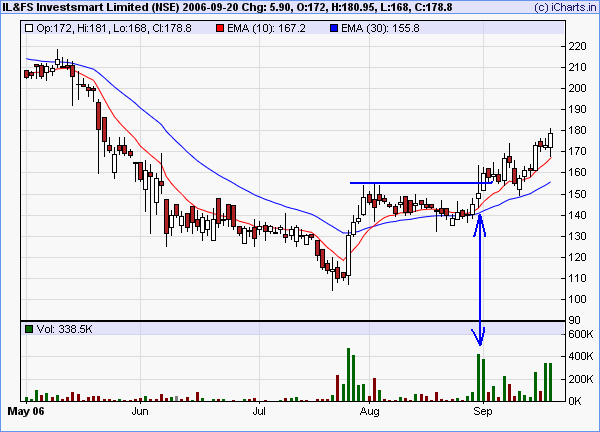
IL & FS InvestSmart Ltd (NSE: INVSTSMART) changed from downtrend to uptrend in late JUL, consolidated a bit and had a breakout in late AUG on strong volume. Since then the stock has been trending very nicely with decent price/volume pattern. Its nearest significant resistance is somewhere around 210-200 area.
| Description: |
|
| Filesize: |
14.18 KB |
| Viewed: |
6892 Time(s) |
|
_________________
Srikanth Kurdukar
@SwingTrader |
|
| Back to top |
|
|
shenoy16
White Belt

Joined: 07 Sep 2006
Posts: 7
|
| Post: #13 Posted: Fri Sep 22, 2006 3:27 pm Post subject: |
|
|
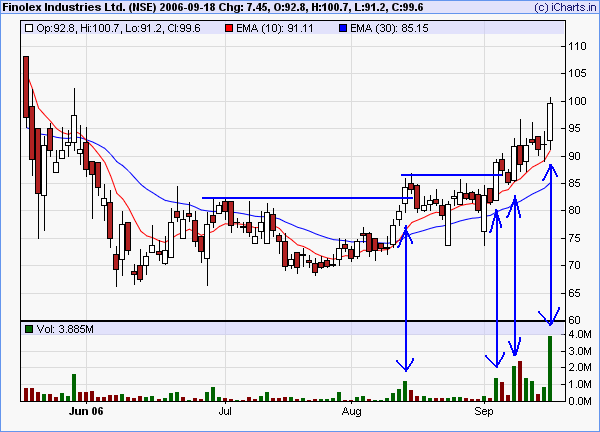
| One intresting thing about this chart, everytime it has risen on good volumes, it seems to have fallen the very next day on equally strong volumes, maybe we can wait for a similar pattern and pick up at a lower price around 90?
|
|
| Back to top |
|
|
SwingTrader
Site Admin
Joined: 11 Aug 2006
Posts: 2903
Location: Hyderabad, India
|
| Post: #14 Posted: Fri Sep 22, 2006 5:37 pm Post subject: |
|
|
| shenoy16 wrote: | | One intresting thing about this chart, everytime it has risen on good volumes, it seems to have fallen the very next day on equally strong volumes, maybe we can wait for a similar pattern and pick up at a lower price around 90? |
IL & FS is rising (it is in a strong uptrend) that is why I was focusing on volume on up days. Pullbacks in a trend (even if it is on the very next day of an up day) is perfectly normal. That is normal profit taking. The thing to watchout for is sustained pullbacks and falling volume on up days which is not happening in this case. I still think IL & FS has a good price vs volume pattern.
I only buy stocks that are rising, I don't try to catch "falling knives" (falling stocks). I wouldn't even look at this stock if it falls to 90. It would come into my stock scan list only if it starts to rise again. Buying stocks after they have fallen is a long term losing strategy. Buy stocks that are rising, this will make money over many trades. That is not to say all your trades will be winners, but you will be far ahead over many trades than if you were just buying stocks that have fallen.
_________________
Srikanth Kurdukar
@SwingTrader |
|
| Back to top |
|
|
shenoy16
White Belt
Joined: 07 Sep 2006
Posts: 7
|
| Post: #15 Posted: Fri Sep 22, 2006 5:45 pm Post subject: |
|
|
| hey ST i am really sorry i did not mention the name of the stock i was talking about Finolex
|
|
| Back to top |
|
|
SwingTrader
Site Admin
Joined: 11 Aug 2006
Posts: 2903
Location: Hyderabad, India
|
| Post: #16 Posted: Fri Sep 22, 2006 6:11 pm Post subject: |
|
|
| shenoy16 wrote: | | hey ST i am really sorry i did not mention the name of the stock i was talking about Finolex |
 There is no need to be sorry...I am glad you are discussing this, it is beneficial to all. I see what you mean and you might have a good point when you say the very next day the stock actually fell on greater volume. I also probably would have avoided the stock if I had seen that if I was selecting the stock at that time. There is no need to be sorry...I am glad you are discussing this, it is beneficial to all. I see what you mean and you might have a good point when you say the very next day the stock actually fell on greater volume. I also probably would have avoided the stock if I had seen that if I was selecting the stock at that time.
Anyway, thanks for your comments, keep them coming so we can have a good discussion.
_________________
Srikanth Kurdukar
@SwingTrader
Last edited by SwingTrader on Fri Sep 22, 2006 6:15 pm; edited 1 time in total |
|
| Back to top |
|
|
SwingTrader
Site Admin
Joined: 11 Aug 2006
Posts: 2903
Location: Hyderabad, India
|
| Post: #17 Posted: Fri Sep 22, 2006 6:14 pm Post subject: |
|
|
Shenoy16,
I just saw FINOLEX chart again and buying at 90 is not a bad idea at all because that would mean only a small pullback  I was going on ranting about not buying falling stocks. So I guess you are right when you say we can actually buy FINOLEX around 90. I also make it a point of not buying into an extended stock. I was going on ranting about not buying falling stocks. So I guess you are right when you say we can actually buy FINOLEX around 90. I also make it a point of not buying into an extended stock.
_________________
Srikanth Kurdukar
@SwingTrader |
|
| Back to top |
|
|
vince
White Belt
Joined: 20 Aug 2006
Posts: 31
|
| Post: #18 Posted: Sun Sep 24, 2006 12:02 pm Post subject: |
|
|
Hi,
Tulip is looking good so far. It could really fly above 306 ,a breakout on the weekly. Swing traders could wait for a pullback after the breakout.
|
|
| Back to top |
|
|
SwingTrader
Site Admin
Joined: 11 Aug 2006
Posts: 2903
Location: Hyderabad, India
|
| Post: #19 Posted: Mon Sep 25, 2006 10:26 am Post subject: |
|
|
Big move for TULIP there...it will be interesting to see how it moves from here.
_________________
Srikanth Kurdukar
@SwingTrader |
|
| Back to top |
|
|
vince
White Belt
Joined: 20 Aug 2006
Posts: 31
|
| Post: #20 Posted: Mon Sep 25, 2006 10:36 am Post subject: |
|
|
| Did I say fly , it looks like its gone ballistic , and 306 was taken out effortlessly.
|
|
| Back to top |
|
|
vince
White Belt
Joined: 20 Aug 2006
Posts: 31
|
| Post: #21 Posted: Mon Sep 25, 2006 11:10 am Post subject: |
|
|
| Did I say fly , it looks like its gone ballistic , and 306 was taken out effortlessly.
|
|
| Back to top |
|
|
shenoy16
White Belt
Joined: 07 Sep 2006
Posts: 7
|
| Post: #22 Posted: Mon Sep 25, 2006 2:52 pm Post subject: Omax Autos |
|
|
Can anyone tell me about Omax Autos charts, has been having a good run of late.
thnx
|
|
| Back to top |
|
|
SwingTrader
Site Admin
Joined: 11 Aug 2006
Posts: 2903
Location: Hyderabad, India
|
| Post: #23 Posted: Mon Sep 25, 2006 9:16 pm Post subject: Re: Omax Autos |
|
|
| shenoy16 wrote: | Can anyone tell me about Omax Autos charts, has been having a good run of late.
thnx |
I guess the market answered you before I got a chance. OMAX AUTO had a super breakout today on HUGE volume. It will probably just take off from here. As Vince puts it - "it looks like its gone ballistic".
_________________
Srikanth Kurdukar
@SwingTrader |
|
| Back to top |
|
|
SwingTrader
Site Admin
Joined: 11 Aug 2006
Posts: 2903
Location: Hyderabad, India
|
| Post: #24 Posted: Mon Sep 25, 2006 9:21 pm Post subject: OSWAL CHEM |
|
|
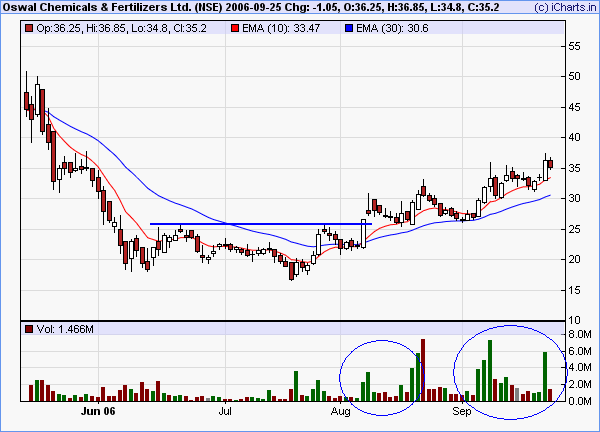
OSWAL CHEM is trending really well after changing trend early AUG. The price vs volume pattern is just fine. It looks set to test its nearest resistance around 50.
| Description: |
|
| Filesize: |
13.93 KB |
| Viewed: |
4575 Time(s) |
|
_________________
Srikanth Kurdukar
@SwingTrader |
|
| Back to top |
|
|
SwingTrader
Site Admin
Joined: 11 Aug 2006
Posts: 2903
Location: Hyderabad, India
|
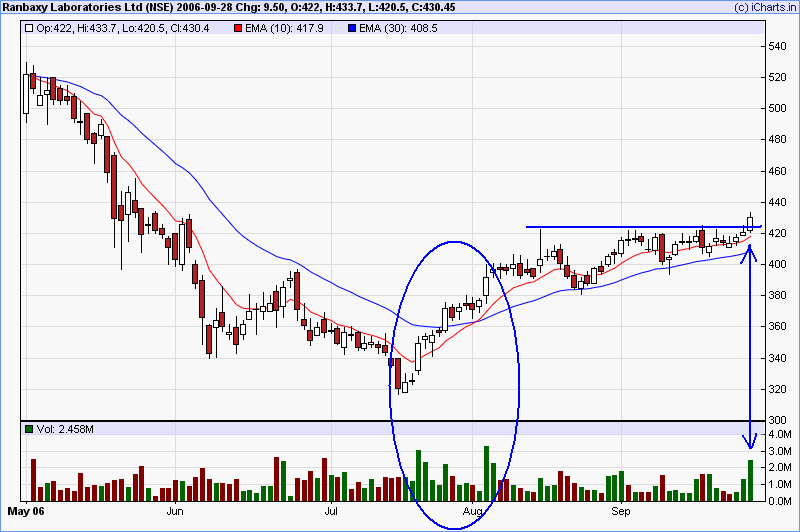
| Post: #25 Posted: Thu Sep 28, 2006 8:41 pm Post subject: Ranbaxy breaks out |
|
|
Ranbaxy has had a long consolidation during the past weeks after its change of trend early AUG. The breakout today was on strong volume and with the nearest resistance around 520 it looks like it will have a nice ride until then if the market remains positive.
| Description: |
|
| Filesize: |
20.53 KB |
| Viewed: |
4563 Time(s) |
|
_________________
Srikanth Kurdukar
@SwingTrader |
|
| Back to top |
|
|
|


