| View previous topic :: View next topic |
| Author |
Interesting Charts (I will try to post one each trading day) |
vince
White Belt

Joined: 20 Aug 2006
Posts: 31
|
Post: #31  Posted: Fri Sep 29, 2006 9:36 am Post subject: Posted: Fri Sep 29, 2006 9:36 am Post subject: |
 |
|
| Success at last.
|
|
| Back to top |
|
 |
|
|
|
SwingTrader
Site Admin
Joined: 11 Aug 2006
Posts: 2903
Location: Hyderabad, India
|
| Post: #32 Posted: Fri Sep 29, 2006 9:44 am Post subject: |
|
|
Great!!! Yes, dhampursug sure looks good. Massive breakout there....
_________________
Srikanth Kurdukar
@SwingTrader |
|
| Back to top |
|
|
SwingTrader
Site Admin
Joined: 11 Aug 2006
Posts: 2903
Location: Hyderabad, India
|
| Post: #33 Posted: Wed Oct 04, 2006 9:36 pm Post subject: BATAINDIA breakout |
|
|
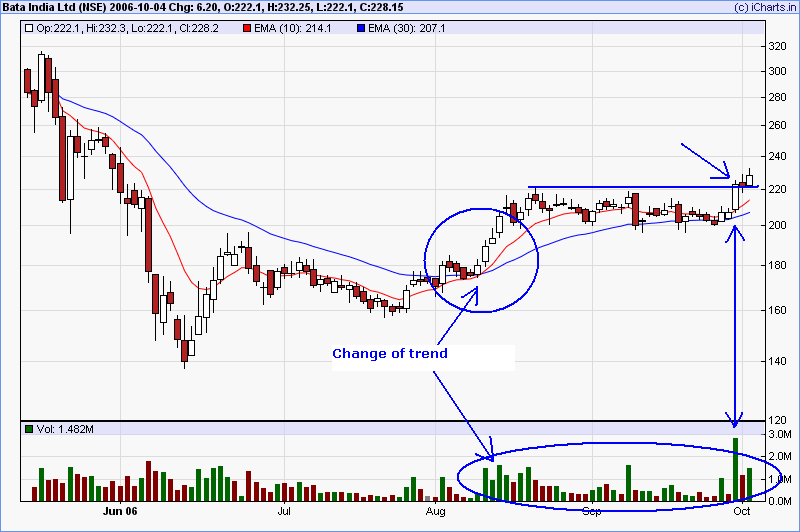
BATAINDIA had a breakout on 29th SEP out of a well formed base. It had changed from downtrend to uptrend in early August confirmed by its rise supported by strong volume. It then formed a long base with strong volume on up days and low volume on down days indicating good price vs volume trend. The breakout on 29th was on huge volume. There is quite a bit of resistance on the way to new highs but at the moment it looks all set to break thru' the resistance if the market continues to perform.
NOTE: If the market corrects here be careful when initiating positions as most stocks would either fall or stall.
| Description: |
|
| Filesize: |
19.6 KB |
| Viewed: |
2473 Time(s) |
|
_________________
Srikanth Kurdukar
@SwingTrader |
|
| Back to top |
|
|
SwingTrader
Site Admin
Joined: 11 Aug 2006
Posts: 2903
Location: Hyderabad, India
|
| Post: #34 Posted: Thu Oct 05, 2006 10:04 pm Post subject: ADHUNIK METALIKS |
|
|
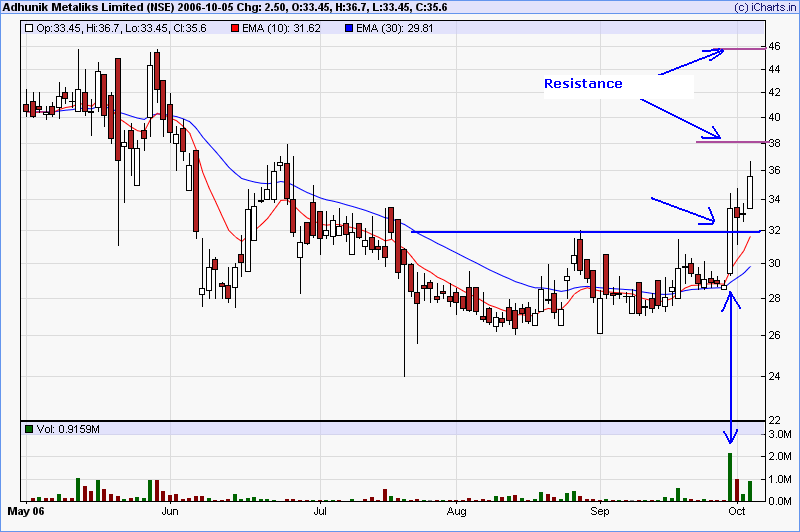
ADHUNIK METALIKS (NSE: ADHUNIK) had a good breakout on Sep 29th and had a very good follow through rally today. It looks all set to clear its nearest resistance around 38 and then carry on to its next resistance around 46.
| Description: |
|
| Filesize: |
19.19 KB |
| Viewed: |
2466 Time(s) |
|
_________________
Srikanth Kurdukar
@SwingTrader |
|
| Back to top |
|
|
shenoy16
White Belt
Joined: 07 Sep 2006
Posts: 7
|
| Post: #35 Posted: Mon Oct 09, 2006 2:27 pm Post subject: ashok leyland |
|
|
| ashok leyland charts look to be smart, news on Volvo taking up a stake has helped this stock move further.
|
|
| Back to top |
|
|
SwingTrader
Site Admin
Joined: 11 Aug 2006
Posts: 2903
Location: Hyderabad, India
|
| Post: #36 Posted: Mon Oct 09, 2006 11:51 pm Post subject: APOLLOTYRE breaksout to new 52-week high |
|
|
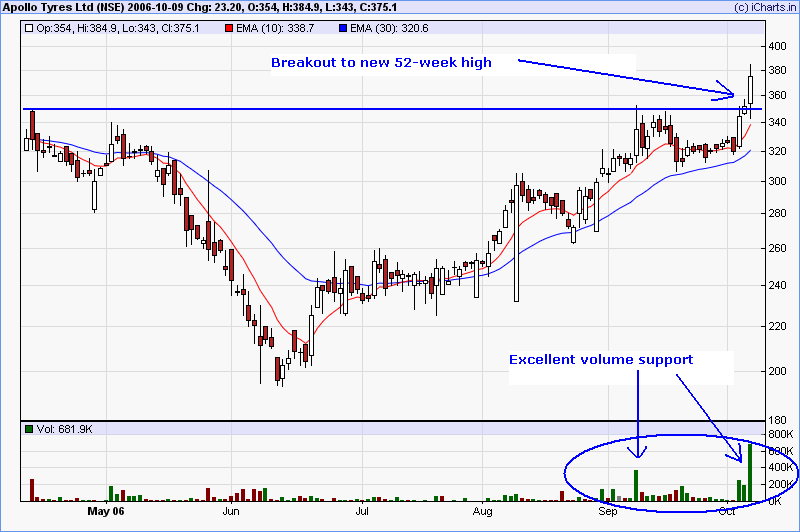
Things look very good for Apollo Tyres Ltd (NSE Code: APOLLOTYRE), it has broken out to new yearly highs. With no resistances in sight it could be smooth sailing for it as long as the broad market reamins supportive. The volume pattern is excellent too with breakout happening on huge volume.
| Description: |
|
| Filesize: |
21.36 KB |
| Viewed: |
2172 Time(s) |
|
_________________
Srikanth Kurdukar
@SwingTrader |
|
| Back to top |
|
|
SwingTrader
Site Admin
Joined: 11 Aug 2006
Posts: 2903
Location: Hyderabad, India
|
| Post: #37 Posted: Mon Oct 09, 2006 11:53 pm Post subject: Re: ashok leyland |
|
|
| shenoy16 wrote: | | ashok leyland charts look to be smart, news on Volvo taking up a stake has helped this stock move further. |
Wow! I love ASHOKLEY chart, the stock is in a solid trend. A bit extended now but just look at that trend!!! I guess it could pause for a while around 52 before launching itself to new highs.
_________________
Srikanth Kurdukar
@SwingTrader |
|
| Back to top |
|
|
SwingTrader
Site Admin
Joined: 11 Aug 2006
Posts: 2903
Location: Hyderabad, India
|
| Post: #38 Posted: Tue Oct 31, 2006 6:46 pm Post subject: GTCIND breakout |
|
|
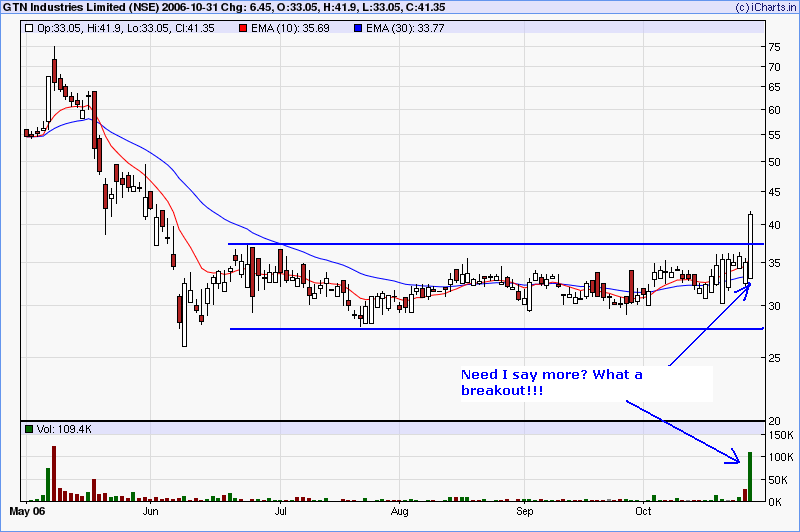
Just one look at GTCIND chart and you will know that today's breakout was an important event for the stock. It was in a very long consolidation after is May-June decline. Such breakouts after long consolidations are usually more reliable and lead to lasting rallies.
I have not been posting on this thread because you can find such candidates very easily using the new "Stock Lists" feature. I found this stock in the "Price / Volume Expansions" list (the first stock on that list today).
| Description: |
|
| Filesize: |
18.19 KB |
| Viewed: |
2076 Time(s) |
|
_________________
Srikanth Kurdukar
@SwingTrader |
|
| Back to top |
|
|
sugandhj
White Belt
Joined: 04 Nov 2006
Posts: 1
|
| Post: #39 Posted: Sat Nov 04, 2006 3:13 pm Post subject: Re: Interesting Charts (I will try to post one each trading |
|
|
| SwingTrader wrote: | MANALIPET looks promising given the recent breakout. It is breaking out of a well formed base on strong volume.
--SwingTrader |
the x -axis has the data upto september middle, we are into november friend.
|
|
| Back to top |
|
|
SwingTrader
Site Admin
Joined: 11 Aug 2006
Posts: 2903
Location: Hyderabad, India
|
| Post: #40 Posted: Sat Nov 04, 2006 11:11 pm Post subject: Re: Interesting Charts (I will try to post one each trading |
|
|
| sugandhj wrote: | | SwingTrader wrote: | MANALIPET looks promising given the recent breakout. It is breaking out of a well formed base on strong volume.
--SwingTrader |
the x -axis has the data upto september middle, we are into november friend. |
I see what you mean. MANALIPET last traded on NSE on 27th Sept 2006. I am not sure what happened to the stock but it is not trading since then. I will see if I can find more info on it.
_________________
Srikanth Kurdukar
@SwingTrader |
|
| Back to top |
|
|
|


