| View previous topic :: View next topic |
| Author |
Interesting Charts (I will try to post one each trading day) |
SwingTrader
Site Admin
Joined: 11 Aug 2006
Posts: 2903
Location: Hyderabad, India
|
Post: #1  Posted: Mon Sep 04, 2006 7:49 pm Post subject: Interesting Charts (I will try to post one each trading day) Posted: Mon Sep 04, 2006 7:49 pm Post subject: Interesting Charts (I will try to post one each trading day) |
 |
|
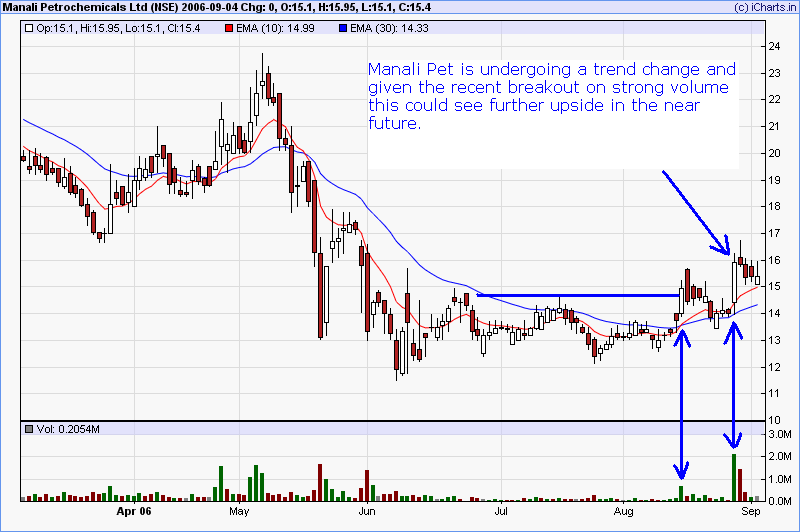
MANALIPET looks promising given the recent breakout. It is breaking out of a well formed base on strong volume.
--SwingTrader
| Description: |
|
| Filesize: |
21.94 KB |
| Viewed: |
5127 Time(s) |
|
|
|
| Back to top |
|
 |
|
|
|
CreditViolet
White Belt

Joined: 22 Aug 2006
Posts: 24
|
| Post: #2 Posted: Mon Sep 04, 2006 11:49 pm Post subject: :) |
|
|
Looks good ST 
CV

|
|
| Back to top |
|
|
SwingTrader
Site Admin
Joined: 11 Aug 2006
Posts: 2903
Location: Hyderabad, India
|
| Post: #3 Posted: Tue Sep 05, 2006 8:14 pm Post subject: GPIL - Classic breakout and pullback |
|
|
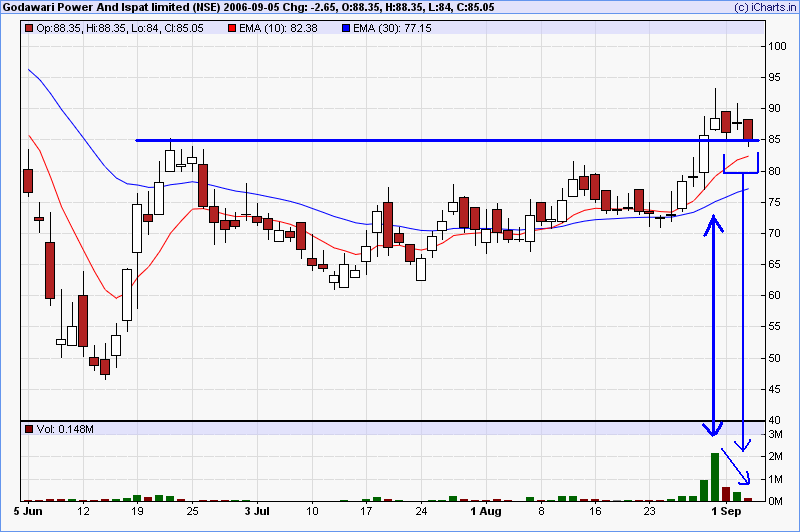
GPIL is a textbook case of a breakout on strong volume out of a well formed base followed by a good pullback on declining volume. This is what I usually look for when entering position trades.
Now how the stock's near future pans out is a totally different matter but all the ingredients are there for a continued rally. I usually look for stocks with such patterns, take position, apply strict risk management and leave everything else to the market. The idea is to ride the stocks that follow thru' the breakout and launch to the upside. If it doesn't work out I am quickly out of the stock and look for other stocks.
--SwingTrader
| Description: |
|
| Filesize: |
19.09 KB |
| Viewed: |
5112 Time(s) |
|
|
|
| Back to top |
|
|
SwingTrader
Site Admin
Joined: 11 Aug 2006
Posts: 2903
Location: Hyderabad, India
|
| Post: #4 Posted: Wed Sep 06, 2006 7:12 pm Post subject: Nitin Spinners |
|
|
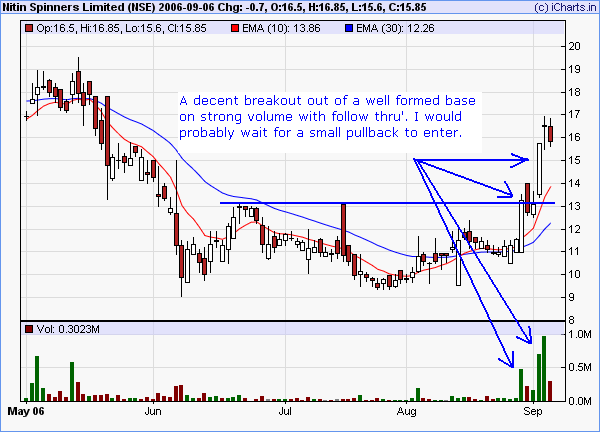
A decent breakout in Nitin Spinners was followed through few days later by a strong rally, that is a good sign. It seems to be a bit extended at the moment so I would probably wait for a pullback to enter (but be aware that very strong rallies don't pullback at all).
Make sure you follow prudent risk/money management when trading. No single trade is important. The aim should be to get consistent results over many trades entered using similar setups (and exits). Following strict entry & exit rules combined with sound money management rules will give you a "statistical edge" which you will realise over many trades.
Happy Trading!!!
| Description: |
|
| Filesize: |
15.9 KB |
| Viewed: |
5094 Time(s) |
|
_________________
Srikanth Kurdukar
@SwingTrader |
|
| Back to top |
|
|
SwingTrader
Site Admin
Joined: 11 Aug 2006
Posts: 2903
Location: Hyderabad, India
|
| Post: #5 Posted: Thu Sep 07, 2006 6:57 pm Post subject: JAYSREETEA in a pullback |
|
|
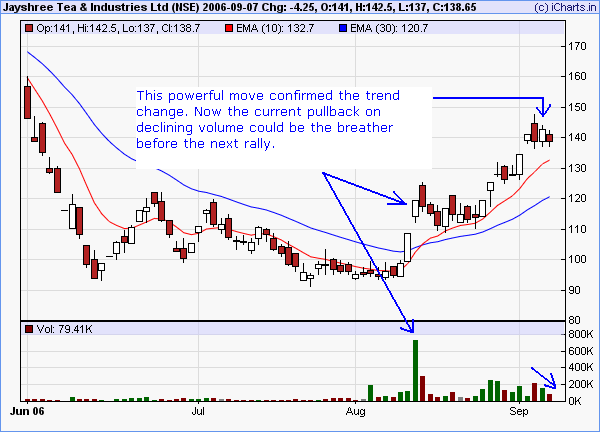
JAYSREETEA confirmed the trend change when it exploded on strong volume in mid-august. The follow thru' to this breakout was decent too. Now it is setting up a textbook pullback on declining volume which could be followed by another rally.
| Description: |
|
| Filesize: |
15.45 KB |
| Viewed: |
5070 Time(s) |
|
_________________
Srikanth Kurdukar
@SwingTrader |
|
| Back to top |
|
|
SwingTrader
Site Admin
Joined: 11 Aug 2006
Posts: 2903
Location: Hyderabad, India
|
| Post: #6 Posted: Fri Sep 08, 2006 7:02 pm Post subject: TVSMOTOR - Excellent breakout & follow through |
|
|
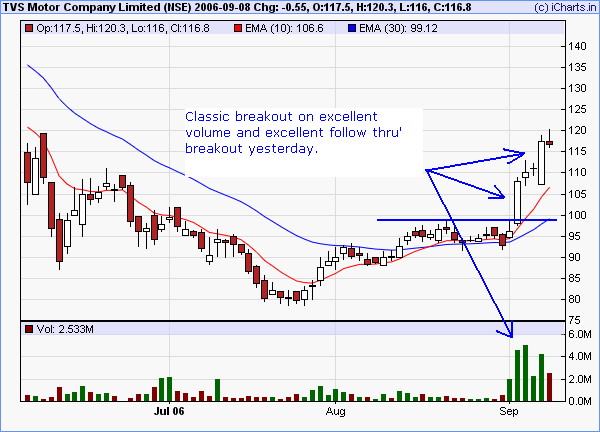
TVSMOTOR shot into a rally after a trend change & consolidation, the breakout on strong volume was followed by another strong day which confirms the breakout. This is a good candidate for position traders. I would wait for a pullback, it is extended at the moment.
As I was saying earlier, the best rallies don't pullback. So what should one do? I usually enter trades in 3:2:1 ratio. I mean if the number of shares I want to buy is 60 and I see such a good stock I buy 30 shares first, if the stock confirms the rally by rallying a bit further (and I am in profit) then I buy 20 more shares, if the stock keeps going further I quickly add 10 more shares thus completing my full position size in the stock. On the other hand when I first buy 30 shares and the rally fizzles out and I am showing loss after few days, I just dump the position and look for some other good stock. This method ensures that when I am winning (in profits) I hold more stock but if I am losing on the trade I hold little stock & exit.
Happy Trading!!!
| Description: |
|
| Filesize: |
14.37 KB |
| Viewed: |
5050 Time(s) |
|
_________________
Srikanth Kurdukar
@SwingTrader |
|
| Back to top |
|
|
SwingTrader
Site Admin
Joined: 11 Aug 2006
Posts: 2903
Location: Hyderabad, India
|
| Post: #7 Posted: Wed Sep 13, 2006 10:12 pm Post subject: ALPS Industries is showing decent accumulation |
|
|
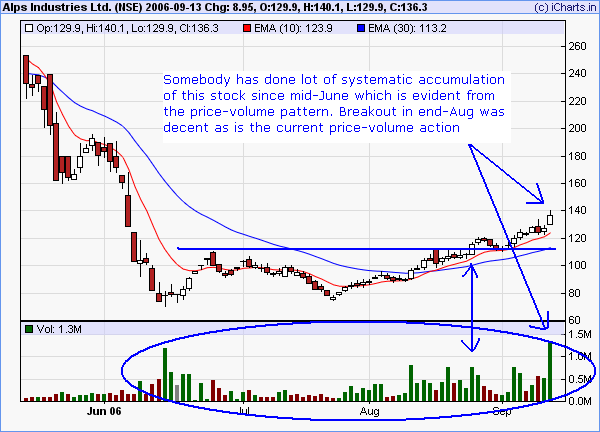
ALPSINDUS bottomed out in mid-June and since then the price-volume pattern is indicating lot of systematic accumulation with stock rising on greater volume and declines on lower volume. On the whole you will see more larger green volume bars and less shorter red bars, this indicates lot of accumulation. Then we see the breakout in end-Aug on decent volume and the recent price action is continuing to show strong price-volume pattern.
Needless to say I am bullish on this stock!!!
| Description: |
|
| Filesize: |
16.2 KB |
| Viewed: |
5016 Time(s) |
|
_________________
Srikanth Kurdukar
@SwingTrader |
|
| Back to top |
|
|
SwingTrader
Site Admin
Joined: 11 Aug 2006
Posts: 2903
Location: Hyderabad, India
|
|
| Back to top |
|
|
vince
White Belt
Joined: 20 Aug 2006
Posts: 31
|
| Post: #9 Posted: Mon Sep 18, 2006 6:12 pm Post subject: finpipe |
|
|
I hope you don,t mind me posting in this thread but it seems pointless to start another one for the same purpose.
Pls check out finpipe. I am unable to do a cut/paste with the chart from this site.By the way how do I post charts.
Regds.
|
|
| Back to top |
|
|
SwingTrader
Site Admin
Joined: 11 Aug 2006
Posts: 2903
Location: Hyderabad, India
|
| Post: #10 Posted: Mon Sep 18, 2006 6:24 pm Post subject: |
|
|
Vince,
You are most welcome to post on this thread.
I usually save the chart as a PNG file on my desktop, add trendlines/comments etc in "MS Paint" and then do a "Add an Attachment" (this option is available when you are posting). Select the PNG file and click "Add Attachment" button, once done do a "Submit".
I am trying to find an easier way to do this but haven't found it yet.
I will post the FINPIPE chart here together with my chart. FINPIPE looks very nice indeed.
_________________
Srikanth Kurdukar
@SwingTrader |
|
| Back to top |
|
|
SwingTrader
Site Admin
Joined: 11 Aug 2006
Posts: 2903
Location: Hyderabad, India
|
| Post: #11 Posted: Mon Sep 18, 2006 6:42 pm Post subject: |
|
|
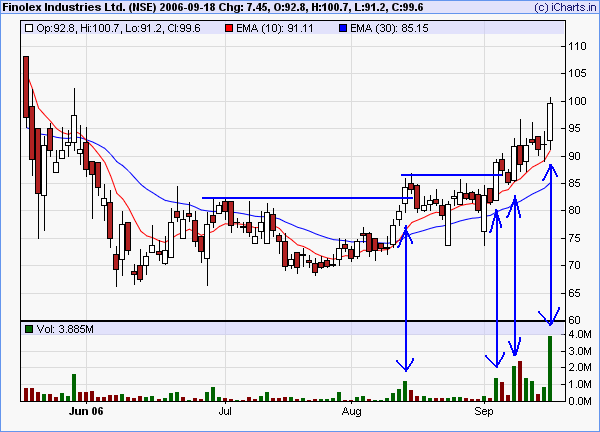
FINPIPE (pointed out by Vince) has very nice price action. The volume vs price action after the breakout & change of trend looks very good. Many powerful moves in it recently. I would jump into it on a small pullback. Not sure about Vince's trading style but many traders don't wait for a pullback in a strong stock because there might not be one until it moves much further up.
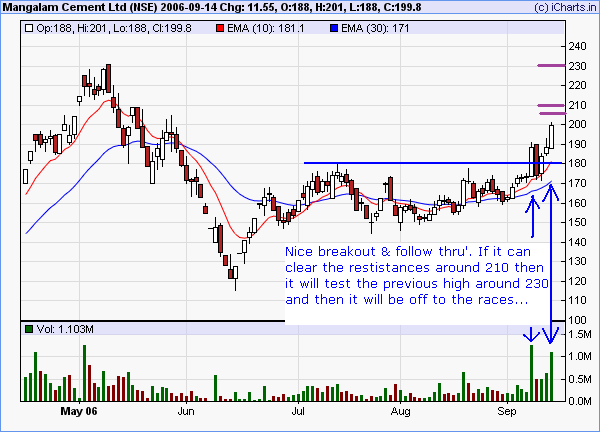
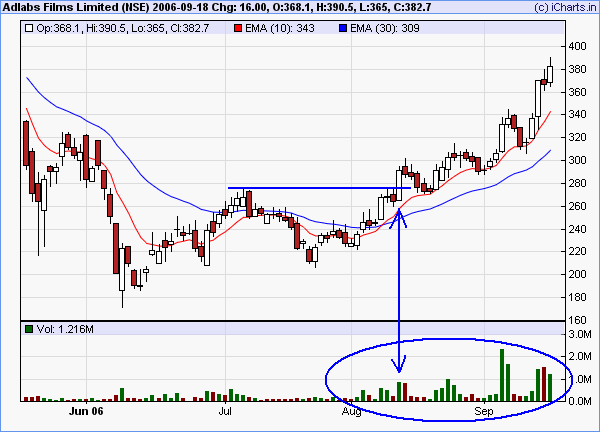
The price action in ADLABSFILM is very nice & steady. It had a decent breakout in early Aug and it has been moving very well after that. It is probably ready for a pullback. The next major resistance is between 440 & 450 and once it breaks thru' it will be off to races. That, of course, is my opinion. What happens ahead is what I am interested in watching too.
| Description: |
|
| Filesize: |
14.05 KB |
| Viewed: |
6950 Time(s) |
|
| Description: |
|
| Filesize: |
14.48 KB |
| Viewed: |
6949 Time(s) |
|
_________________
Srikanth Kurdukar
@SwingTrader |
|
| Back to top |
|
|
SwingTrader
Site Admin
Joined: 11 Aug 2006
Posts: 2903
Location: Hyderabad, India
|
| Post: #12 Posted: Wed Sep 20, 2006 7:25 pm Post subject: IL & FS InvestSmart Ltd |
|
|
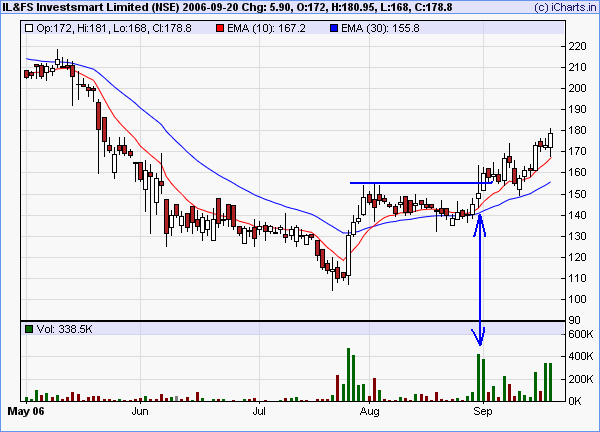
IL & FS InvestSmart Ltd (NSE: INVSTSMART) changed from downtrend to uptrend in late JUL, consolidated a bit and had a breakout in late AUG on strong volume. Since then the stock has been trending very nicely with decent price/volume pattern. Its nearest significant resistance is somewhere around 210-200 area.
| Description: |
|
| Filesize: |
14.18 KB |
| Viewed: |
6927 Time(s) |
|
_________________
Srikanth Kurdukar
@SwingTrader |
|
| Back to top |
|
|
shenoy16
White Belt
Joined: 07 Sep 2006
Posts: 7
|
| Post: #13 Posted: Fri Sep 22, 2006 3:27 pm Post subject: |
|
|
| One intresting thing about this chart, everytime it has risen on good volumes, it seems to have fallen the very next day on equally strong volumes, maybe we can wait for a similar pattern and pick up at a lower price around 90?
|
|
| Back to top |
|
|
SwingTrader
Site Admin
Joined: 11 Aug 2006
Posts: 2903
Location: Hyderabad, India
|
| Post: #14 Posted: Fri Sep 22, 2006 5:37 pm Post subject: |
|
|
| shenoy16 wrote: | | One intresting thing about this chart, everytime it has risen on good volumes, it seems to have fallen the very next day on equally strong volumes, maybe we can wait for a similar pattern and pick up at a lower price around 90? |
IL & FS is rising (it is in a strong uptrend) that is why I was focusing on volume on up days. Pullbacks in a trend (even if it is on the very next day of an up day) is perfectly normal. That is normal profit taking. The thing to watchout for is sustained pullbacks and falling volume on up days which is not happening in this case. I still think IL & FS has a good price vs volume pattern.
I only buy stocks that are rising, I don't try to catch "falling knives" (falling stocks). I wouldn't even look at this stock if it falls to 90. It would come into my stock scan list only if it starts to rise again. Buying stocks after they have fallen is a long term losing strategy. Buy stocks that are rising, this will make money over many trades. That is not to say all your trades will be winners, but you will be far ahead over many trades than if you were just buying stocks that have fallen.
_________________
Srikanth Kurdukar
@SwingTrader |
|
| Back to top |
|
|
shenoy16
White Belt
Joined: 07 Sep 2006
Posts: 7
|
| Post: #15 Posted: Fri Sep 22, 2006 5:45 pm Post subject: |
|
|
| hey ST i am really sorry i did not mention the name of the stock i was talking about Finolex
|
|
| Back to top |
|
|
|