| View previous topic :: View next topic |
| Author |
Interpreting the indicators |
charav
White Belt

Joined: 18 May 2009
Posts: 15
|
Post: #1  Posted: Wed Jun 03, 2009 5:48 pm Post subject: Interpreting the indicators Posted: Wed Jun 03, 2009 5:48 pm Post subject: Interpreting the indicators |
 |
|
Hello everybody.
First thing – my apologies, if the issue I write about is impertinent to this forum topic.
I do not find any discussion regarding day trading in cash market in any of the forum topics. I sincerely believe that you should start one. Whether day trading in cash market is desirable or not is a subjective matter. Hence, it should be left to one’s own judgment – no argument about that.
I have only rudimental knowledge in technical analysis/trading. I seriously started studying it in the recent past, thanks to your valuable forum discussions.
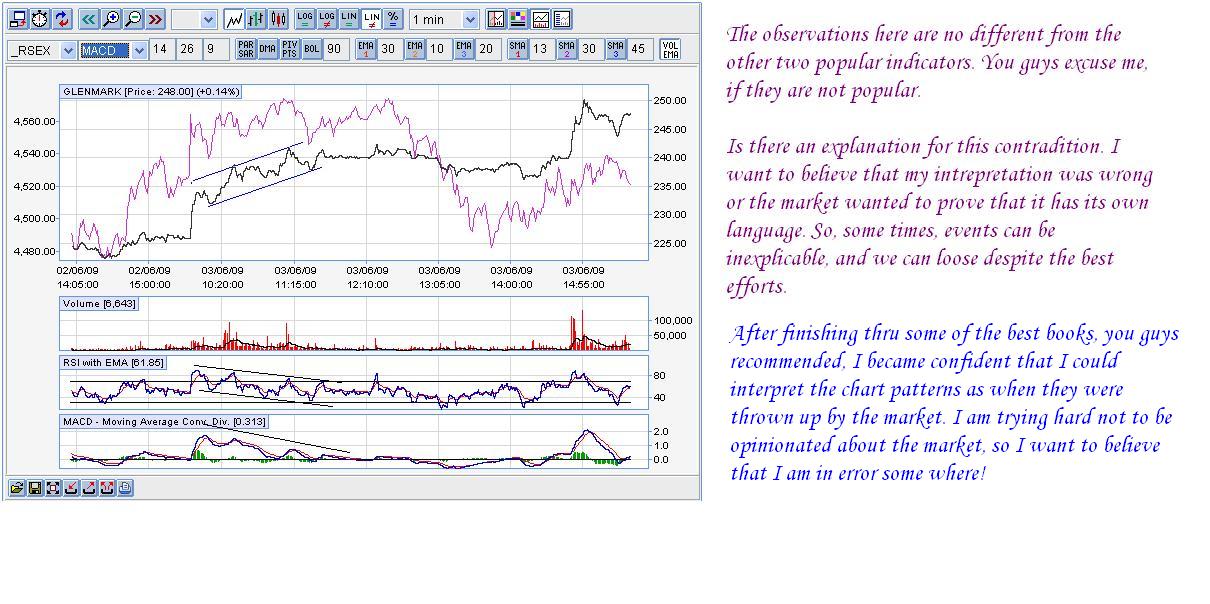
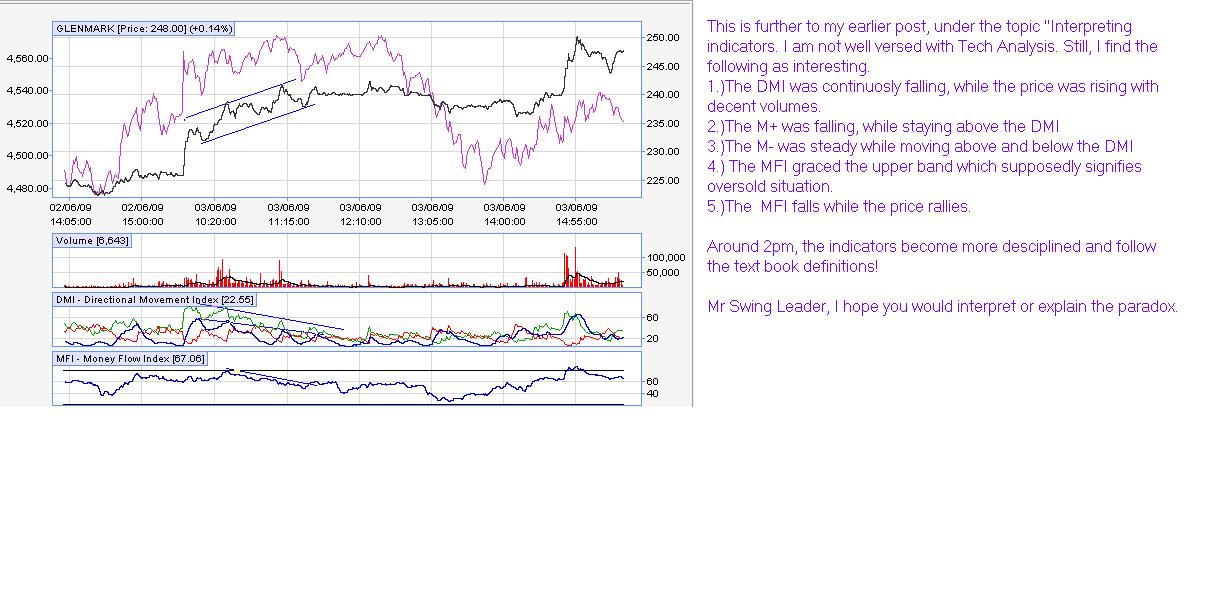
Today, I looked at Glenmark chart and was baffled that the price rallied while all the indicators like RSI, RSEX, MACD, DMI and MFI gave strong bearish signals till 11.30AM (price went up app by 10%, by that time).
Was it an aberration that happens once in a while or my interpretation was faulty. Is there an indicator that would have given the correct signal about the rally?I haven’t traded the scrip. In fact I am not trading at all, but trying to interpret the signals. You see, I have been losing money for over a decade and that made me a little wiser I suppose. Please do not kill the topic, saying that I will loose more, in day trading. I will take the call on it myself at a later date.
Another small issue: I am posting the topic at 5.46pm on 03-06-09. There seem to be some confusion!
Thanks and regards.
|
|
| Back to top |
|
 |
|
| |
charav
White Belt
Joined: 18 May 2009
Posts: 15
|
| Post: #2 Posted: Wed Jun 03, 2009 11:57 pm Post subject: Post subject: Interpreting the indicators-2 |
|
|
I haven't attached the charts concerned earlier. Please find them attached .
| Description: |
|
| Filesize: |
146.14 KB |
| Viewed: |
2570 Time(s) |
|
| Description: |
|
| Filesize: |
113.83 KB |
| Viewed: |
2570 Time(s) |
|
|
|
| Back to top |
|
|
|
|
You cannot post new topics in this forum
You cannot reply to topics in this forum
You cannot edit your posts in this forum
You cannot delete your posts in this forum
You cannot vote in polls in this forum
You can attach files in this forum
You can download files in this forum
|
Powered by phpBB © 2001, 2005 phpBB Group
|
|


