| View previous topic :: View next topic |
| Author |
intraday system for trading with candles in trending markets |
worsttrader
White Belt

Joined: 24 May 2008
Posts: 39
|
Post: #1  Posted: Thu Aug 29, 2013 10:29 am Post subject: intraday system for trading with candles in trending markets Posted: Thu Aug 29, 2013 10:29 am Post subject: intraday system for trading with candles in trending markets |
 |
|
Here is a word document of the conversation explaining how to use candles to trade intraday during trending market conditions.
| Description: |
|

Download |
| Filename: |
vijaydevanissystem_124.doc |
| Filesize: |
72 KB |
| Downloaded: |
1331 Time(s) |
|
|
| Back to top |
|
 |
|
|
|
SUNIL_PATIL_34
White Belt
Joined: 29 Sep 2009
Posts: 72
|
| Post: #2 Posted: Fri Aug 30, 2013 12:47 am Post subject: hi |
|
|
27-Aug 15:20 vijaydevani in such situations, i place my first buy and sell orders 13 points above and below the high and low of the first candle.
hi sir 3 points abv or below or 13 points
|
|
| Back to top |
|
|
SUNIL_PATIL_34
White Belt
Joined: 29 Sep 2009
Posts: 72
|
| Post: #3 Posted: Fri Aug 30, 2013 1:08 am Post subject: hi |
|
|
hi sir its a great system many thanks for sharing;
Can we use it on 1 hour tf
|
|
| Back to top |
|
|
worsttrader
White Belt
Joined: 24 May 2008
Posts: 39
|
| Post: #4 Posted: Fri Aug 30, 2013 11:17 am Post subject: Re: hi |
|
|
| SUNIL_PATIL_34 wrote: | 27-Aug 15:20 vijaydevani in such situations, i place my first buy and sell orders 13 points above and below the high and low of the first candle.
hi sir 3 points abv or below or 13 points |
13 points above below first candle 3 points for SL and SAR.
|
|
| Back to top |
|
|
worsttrader
White Belt
Joined: 24 May 2008
Posts: 39
|
| Post: #5 Posted: Fri Aug 30, 2013 11:51 am Post subject: questions regarding the theory |
|
|
Hi. I am not in the habit of looking at the post. So if anyone has any questions about the theory, I would prefer it if you contacted me either by PM or on SB and I will be happy to answer your questions. Queries posted here might not be answered simply because I forgot to check the post.
Thank you.
|
|
| Back to top |
|
|
nkiran
White Belt
Joined: 02 Apr 2010
Posts: 38
|
| Post: #6 Posted: Fri Aug 30, 2013 10:06 pm Post subject: |
|
|
Hi,
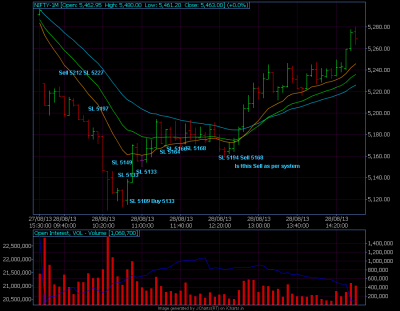
Can you please check and confirm if this test is correct ?
Also suggest corrections if any.
regards,
nkiran
| Description: |
|
| Filesize: |
35.17 KB |
| Viewed: |
935 Time(s) |
|
|
|
| Back to top |
|
|
worsttrader
White Belt
Joined: 24 May 2008
Posts: 39
|
| Post: #7 Posted: Sat Aug 31, 2013 9:13 am Post subject: |
|
|
| nkiran wrote: | Hi,
Can you please check and confirm if this test is correct ?
Also suggest corrections if any.
regards,
nkiran |
The sell at 5168 is a sell strictly as per system. But usually when the market trades in a range like it has before the sell has been triggered, the sell call should not be taken because it is more likely a false call. Basically after the range trade, it is better to switch to 13 points trigger for both buy and sell. So You can use the SL but should not use the SL as an SAR.
|
|
| Back to top |
|
|
nkiran
White Belt
Joined: 02 Apr 2010
Posts: 38
|
| Post: #8 Posted: Sat Aug 31, 2013 7:05 pm Post subject: |
|
|
| vijaydevani wrote: | | nkiran wrote: | Hi,
Can you please check and confirm if this test is correct ?
Also suggest corrections if any.
regards,
nkiran |
The sell at 5168 is a sell strictly as per system. But usually when the market trades in a range like it has before the sell has been triggered, the sell call should not be taken because it is more likely a false call. Basically after the range trade, it is better to switch to 13 points trigger for both buy and sell. So You can use the SL but should not use the SL as an SAR. |
Thanks Vijay,
1. So SL 5168, and SAR 5168-10 = 5158. i.e. Short below 5158. AM i right ?
2. When to take next buy/sell ?
3. Can we think of buy at 5186 i.e. 13 points above 12:29 candle ? If yes what would be SL ? (ema are in line till we execute this buy)
Need your help here.
regards,
niran
|
|
| Back to top |
|
|
worsttrader
White Belt
Joined: 24 May 2008
Posts: 39
|
| Post: #9 Posted: Mon Sep 02, 2013 8:06 am Post subject: |
|
|
| nkiran wrote: | | vijaydevani wrote: | | nkiran wrote: | Hi,
Can you please check and confirm if this test is correct ?
Also suggest corrections if any.
regards,
nkiran |
The sell at 5168 is a sell strictly as per system. But usually when the market trades in a range like it has before the sell has been triggered, the sell call should not be taken because it is more likely a false call. Basically after the range trade, it is better to switch to 13 points trigger for both buy and sell. So You can use the SL but should not use the SL as an SAR. |
Thanks Vijay,
1. So SL 5168, and SAR 5168-10 = 5158. i.e. Short below 5158. AM i right ?
2. When to take next buy/sell ?
3. Can we think of buy at 5186 i.e. 13 points above 12:29 candle ? If yes what would be SL ? (ema are in line till we execute this buy)
Need your help here.
regards,
niran |
Buy and sell would both be 10 points above below the highest high and lowest low of the range bound trade formed.
|
|
| Back to top |
|
|
worsttrader
White Belt
Joined: 24 May 2008
Posts: 39
|
| Post: #10 Posted: Mon Sep 02, 2013 8:10 am Post subject: don't be desperate to trade |
|
|
| There are a lot of places in the system where you can take SL and SAR. When in doubt DO NOT take the SAR. It is not necessary to be able to catch all the trades. When you miss a trade, and the market moves viciously in the direction of the trade you should have taken, you will obviously get the feeling of having missed a great trade. Learn to accept that feeling. If that feeling overwhelms you, you will end up trying to enter the move at wrong levels and just keep accumulating losses. It is as important to miss a trade as it is to take one. When in doubt, DO NOT TRADE. It does not matter if you miss a good trade but it does matter if you take a hurried wrong trade and make losses. The idea of trading is to minimize your losses. Always remember this.
|
|
| Back to top |
|
|
SUNIL_PATIL_34
White Belt
Joined: 29 Sep 2009
Posts: 72
|
| Post: #11 Posted: Mon Sep 02, 2013 9:11 am Post subject: |
|
|
yes vijay true
everyone remember that there is unlimited money in the market and we
have only limited money in our hand !!!!
|
|
| Back to top |
|
|
worsttrader
White Belt
Joined: 24 May 2008
Posts: 39
|
| Post: #12 Posted: Wed May 13, 2015 3:11 pm Post subject: ww pattern |
|
|
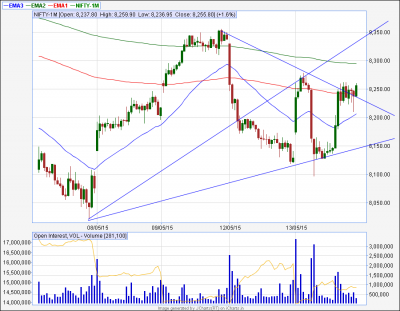
WW pattern formed since 11-05.
| Description: |
|
| Filesize: |
40.76 KB |
| Viewed: |
544 Time(s) |
|
|
|
| Back to top |
|
|
vishytns
White Belt
Joined: 26 Nov 2009
Posts: 206
|
| Post: #13 Posted: Wed May 13, 2015 4:26 pm Post subject: Re: ww pattern |
|
|
Worsttrader, the wolf wave looks worst 
| worsttrader wrote: | | WW pattern formed since 11-05. |
|
|
| Back to top |
|
|
|


