| View previous topic :: View next topic |
| Author |
JSWSTEEL ....Price action |
sumesh_sol
Brown Belt

Joined: 06 Jun 2010
Posts: 2344
|
|
| Back to top |
|
 |
|
|
|
amitagg
Black Belt

Joined: 01 Oct 2013
Posts: 4559
|
Post: #2  Posted: Sat Aug 23, 2014 7:09 pm Post subject: Posted: Sat Aug 23, 2014 7:09 pm Post subject: |
 |
|
One of The most interesting post since I joined icharts ( except some similar analysis method done by Sherbaaz)
Not looking at actual chart in software for precise comments but the picture given be you:
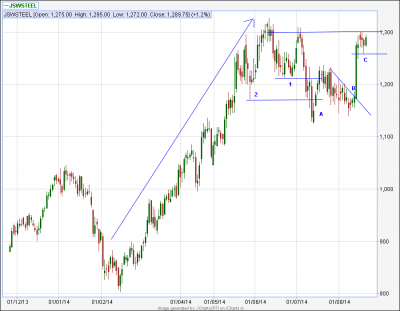
1. Irrespective of crowd behaviour which unfolds( explained later) ( Fii Dii hni retail all being part of this crowd)..... I agree with your " entry point" for shorts
2. Exit point - first tranche ( or even more that 50 percent ) can be base of big bull candle after point B ( eg 1190 odd giving 1.5 RR)... This is also " untested professional demand level" ( I cannot explain more than this in his forum) ( it has nothing to do with candlestick based trading)
This would save the risks if the following medium trend is "sideways"
Why I mentioned even more than 50 percent profit booking here ( though swing RR should be at least 3:1) is because a re entry short can be taken basis price action AND sector action AND nifty action then - this is called " top down approach"
3. Now coming to what is " possible scenarios for crowd behaviour"
- option a : harmonic in play and since prices gave retraced 80 percent and upmove beyond 1300 to target 1.27X is possible
Your trading strategy fits this scenarios as well except the following 2 comments ( one variation can be short entry below a fibo retrace of say 61.8 percent of last bull move from point A/ b etc. but this shall lower the RR as per my method above not so much in your exit points) ( two if your entry short taken, price may move below 1260 to trigger shorts " but not by much" and then move to 1300 or little above or 1.27 above subsequently triggering a loss exit)
- option b: as per al brooks, this action triggers two steps down from top of " swing failure top" ie where prices did not break 1300 earlier reached but came close. This means that one additional down move below the current swing low should unfold.
But My interpretation of this however over the years has been that in " bullish conditions" this " price pattern" leads to further bullishness seen in dr reddy and others ( doubt this time sincerely bullish trend shall continue since I am not very bullish on nifty and china pmi etc down bla bla)- this is divulgingg from pure chart price crowd analysis, nevertheless
4. Suppose or assume for time being that market was very bullish and stock was bullish due to discounting of favourable fundamentals etc... Suppose.... Then in that situation this price action would have " enabled the big guns or better word winning crowd whichever faction it may be " to get longs exit, get entry for shorters, and then move price up up... To leave both longs ( no opportunity profit) and shorts ( actual loss) aside.
This cannot be predicted .... Therefore to predict crowd behaviour we have to rely on TA also. U are basing a trading decision basis estimation of price movement which has " still NOT fully reflected of the crowd behaviour or what the crowd wants to do". This for me is a very Important point ( irrespective r of whether u are right or wrong because by toss of coin also we can be right 50 percent of the time )
5 shall come back with more thoughts
|
|
| Back to top |
|
|
amitagg
Black Belt
Joined: 01 Oct 2013
Posts: 4559
|
| Post: #3 Posted: Sat Aug 23, 2014 7:30 pm Post subject: |
|
|
PLEASE READ THIS POST and SUMESH POST ONLY
A problem with such posts however it that independent view which u want to get can never be there..... For example people viewing your post and then mine shall be " prejudiced" " naturally" or better word " sub consciously" whether it it felt or not, by the comments.....
And each successive post shall suffer from this even more..... ( this is based on one MTA video I had seen as to how our thoughts are aligned or adjusted.... )
But a more critical analysis is an advantage..... And that is most we can do
Note: request all members who see this to have their view framed basis on Sumesh post and no others and then read other posts and then see how they would like to refine their views and possibly post both views
This would actually help to understand psychology. And have THIS post copied and pasted on top of all your comments( if at all)
|
|
| Back to top |
|
|
sureenderkalra
White Belt

Joined: 11 Dec 2012
Posts: 174
|
| Post: #4 Posted: Sat Aug 23, 2014 7:45 pm Post subject: JSWSTEEL |
|
|
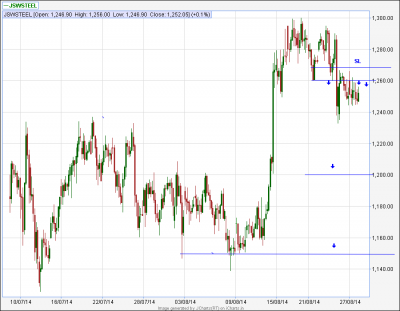
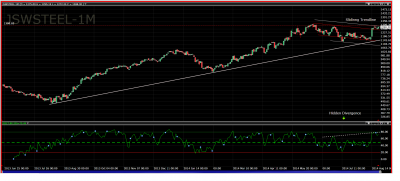
Stock is still in uptrend and trading between trendline and sliding trendline. It might touch 1399 -1460 on upper side once it breaks sliding trendline and has a fair chance of any major correction from this point.
On the other hand, RSI is with hidden divergence which it indicates it might move down as you expect. But I dont think it will move below 1215 if c point marked by you is broken. We should recheck this once it touches 1215.
Chart is attached.
| Description: |
|
| Filesize: |
161.43 KB |
| Viewed: |
582 Time(s) |
|
|
|
| Back to top |
|
|
dynamite_munda11
Yellow Belt

Joined: 14 Nov 2010
Posts: 681
|
| Post: #5 Posted: Sun Aug 24, 2014 8:43 am Post subject: jswsteel |
|
|
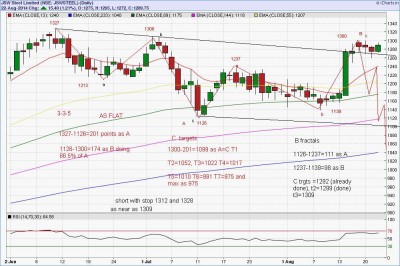
jswsteel imho is probabily doing a flat as 335 and has probabily completed B wave at 1300 or would complete max at 1309, down C trgts are mentioned on chart and stop loss mentioned for shorts
| Description: |
|
| Filesize: |
126.07 KB |
| Viewed: |
633 Time(s) |
|
|
|
| Back to top |
|
|
amitagg
Black Belt
Joined: 01 Oct 2013
Posts: 4559
|
| Post: #6 Posted: Sun Aug 24, 2014 9:14 am Post subject: Re: jswsteel |
|
|
| dynamite_munda11 wrote: | | jswsteel imho is probabily doing a flat as 335 and has probabily completed B wave at 1300 or would complete max at 1309, down C trgts are mentioned on chart and stop loss mentioned for shorts |
1 question and 1 result
- why not a 33333 triangle forming and hence a decline possible but only 3 legged till swing low or b of B? Is stop loss level max ext of 3 wave considered within 335? What percentage used
- either ways since not a zigzag a higher short target which Sumesh has in mind should not be considered
|
|
| Back to top |
|
|
welgro
Brown Belt
Joined: 24 Sep 2012
Posts: 1784
|
| Post: #7 Posted: Sun Aug 24, 2014 10:21 am Post subject: |
|
|
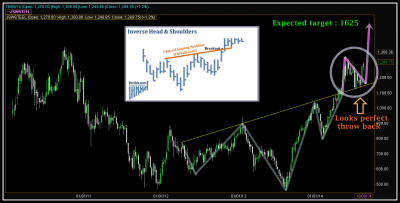
Upward Sloping Neckline. upward sloping neckline of the reverse head and shoulders pattern. A line drawn between the two peak highs is called the neckline.
| Description: |
|
| Filesize: |
149.4 KB |
| Viewed: |
672 Time(s) |
|
|
|
| Back to top |
|
|
chiragbvyas
White Belt
Joined: 18 Feb 2010
Posts: 469
|
| Post: #8 Posted: Mon Aug 25, 2014 9:28 pm Post subject: hi |
|
|
Dear Friends,
I am also Joining the discussion...
As per my T A ... The views are
- A close above 1439 will be on Break Out for long term Bull.
- Once it happens ..on retress up to 1365 one can add long with s l of 1292. if close below 1292 long trade is over and any rise up to 1439 can be shorted with 1439 closing base stop loss.
- A close below 1148 will be break down for long term Bear.
- Once it happens .. on retress up to 1220 can be shorted with closing base s l of 1294, if close above 1294 then short trade is over and any decline up to 1148 can be bought with closing base s l of 1148.
So all we have to do is remember just 5 figures ...
1439 - 1365 - 1292/1294 - 1220 - 1148
Let us see how it unfolds and how price behaviour gives honour to above levels. (All stated numbers are of NSE spot).
Hope this will be helpful to Swing Traders ....
|
|
| Back to top |
|
|
chiragbvyas
White Belt
Joined: 18 Feb 2010
Posts: 469
|
| Post: #9 Posted: Tue Aug 26, 2014 6:36 am Post subject: hi |
|
|
Dear Friends,
I would like to add Jindal steel as a case study, hope nobody will oppose as it is posted in JSWSteel thread ... as it has seen heavy down fall , but as per my T A it has tested only supports and not broken or closed below them... have a look ...
For JINDALSTEEL My views are ..
Just five figures ..
281.45 - 267.25 - 252/254 - 238.90 - 224.72
Just see bottom & close, just like an Edge !!!
You know from JSW post , how to play these numbers ...
This just for noticing purpose that the script was more than 15% down but my level of s l is saved. So i will go long with closing base s l .
Hope it will help who want to take advantage of downfall in this script.
|
|
| Back to top |
|
|
chiragbvyas
White Belt
Joined: 18 Feb 2010
Posts: 469
|
| Post: #10 Posted: Tue Aug 26, 2014 11:40 am Post subject: Re: hi |
|
|
| chiragbvyas wrote: | Dear Friends,
I would like to add Jindal steel as a case study, hope nobody will oppose as it is posted in JSWSteel thread ... as it has seen heavy down fall , but as per my T A it has tested only supports and not broken or closed below them... have a look ...
For JINDALSTEEL My views are ..
Just five figures ..
281.45 - 267.25 - 252/254 - 238.90 - 224.72
Just see bottom & close, just like an Edge !!!
You know from JSW post , how to play these numbers ...
This just for noticing purpose that the script was more than 15% down but my level of s l is saved. So i will go long with closing base s l .
Hope it will help who want to take advantage of downfall in this script. |
I am long in this counter @ 239 with closing base s l of 224. Anyone who is long ?
|
|
| Back to top |
|
|
kishjk7551
White Belt
Joined: 26 Jan 2008
Posts: 293
|
| Post: #11 Posted: Tue Aug 26, 2014 11:49 am Post subject: Re: hi |
|
|
I am long in this counter @ 239 with closing base s l of 224. Anyone who is long ?[/quote]
Count me in Chirag. 
|
|
| Back to top |
|
|
chiragbvyas
White Belt
Joined: 18 Feb 2010
Posts: 469
|
| Post: #12 Posted: Wed Aug 27, 2014 9:23 am Post subject: |
|
|
JIndalstel ...
The rewarding trade that taken long yesterday
Now waiting for tgts as 253 267 281 will book 25 % @ each lvl last 25 % purely @ s l
|
|
| Back to top |
|
|
chiragbvyas
White Belt
Joined: 18 Feb 2010
Posts: 469
|
| Post: #13 Posted: Wed Aug 27, 2014 3:37 pm Post subject: |
|
|
| chiragbvyas wrote: | JIndalstel ...
The rewarding trade that taken long yesterday
Now waiting for tgts as 253 267 281 will book 25 % @ each lvl last 25 % purely @ s l |
Jindalstel closed @ 244.20 !!!
|
|
| Back to top |
|
|
sumesh_sol
Brown Belt
Joined: 06 Jun 2010
Posts: 2344
|
|
| Back to top |
|
|
amitagg
Black Belt
Joined: 01 Oct 2013
Posts: 4559
|
| Post: #15 Posted: Thu Aug 28, 2014 9:31 am Post subject: Re: JSWSTEEL ....Price action |
|
|
| sumesh_sol wrote: | | sumesh_sol wrote: |
Now , with this *assumptions* does it not make sense to initiate Short position below point-C (1260) with SL little above 1300 ?? |
Thank you all for analyzing this setup and giving your valuable feedback...
Having broken 1260, the price appears to have halted (may be in line with broad market). Please look at what is happening on hourly chart. Here, I feel demand has dried up so it is failing to move above 1260 convincingly even after repeated attempts. In other words, it is being *sold* around 1260. My opinion is if short positions becomes heavy then it might fall like rain when clouds become heavy 
I'm tempted to buy PUTs at current level till price falls to 1200 & 1150 levels. SL for the position can be 1270, because beyond that this assumption is nullified.
Any take on this ?? |
Sir u are dead right in my view.... I also took tata steel pi being more liquid and felt futures can be whipsawed and hence comprised on profitability that a future can give..... Not seen the chart let me say actually since your first post on Jsw steel..... But it's working as a said ... Ie entry at leafs I am with you whatever is the result.... Stop had to be above dynamite close levels ... For put sep u may not need a stop actually
|
|
| Back to top |
|
|
|