| View previous topic :: View next topic |
| Author |
lead-alumini-crude |
gopal_1438
White Belt

Joined: 24 Feb 2013
Posts: 223
|
Post: #1606  Posted: Mon Oct 28, 2013 11:53 am Post subject: Posted: Mon Oct 28, 2013 11:53 am Post subject: |
 |
|
| Rohanbhai dopahar me karte hai Havan
|
|
| Back to top |
|
 |
|
|
|
rohan.sharma
Yellow Belt

Joined: 16 Oct 2012
Posts: 856
|
| Post: #1607 Posted: Mon Oct 28, 2013 1:50 pm Post subject: |
|
|
| gopal_1438 wrote: | | Rohanbhai dopahar me karte hai Havan |
lagta hai aapne havan start kar diya..  
|
|
| Back to top |
|
|
rohan.sharma
Yellow Belt
Joined: 16 Oct 2012
Posts: 856
|
| Post: #1608 Posted: Mon Oct 28, 2013 1:55 pm Post subject: |
|
|
| rohan.sharma wrote: | | gopal_1438 wrote: | | Rohanbhai dopahar me karte hai Havan |
lagta hai aapne havan start kar diya.. |
Lagta hai aap sirf Aluminium and lead naamha kar rahe hai..
jaara crudaaya naaha kariye..

|
|
| Back to top |
|
|
mohitshukla2021
White Belt
Joined: 14 Feb 2012
Posts: 275
|
| Post: #1609 Posted: Mon Oct 28, 2013 2:21 pm Post subject: |
|
|
Long in crude now...
Hawan chalu rakho
|
|
| Back to top |
|
|
rohan.sharma
Yellow Belt
Joined: 16 Oct 2012
Posts: 856
|
| Post: #1610 Posted: Mon Oct 28, 2013 9:10 pm Post subject: |
|
|
Crudaaaya namha Savahha

|
|
| Back to top |
|
|
parva
White Belt
Joined: 07 Dec 2009
Posts: 89
|
| Post: #1611 Posted: Tue Oct 29, 2013 1:24 am Post subject: Lead Aluminium Crude backtest results |
|
|
Dear Rohan Sharmaji ..
I read your thread and want to know what are the gains every month using this strategy . Moreover I request you to post the strategy in a separate thread as I found it difficult to read as some changes I came across while reading it on different pages. Now it has more that 160 pages so quite difficult to find all finer point at one place.
Awaiting your reply .
Regards
Parva
P. S Please give results till now of Lead Aluminium and Crude . Thanks .
|
|
| Back to top |
|
|
rohan.sharma
Yellow Belt
Joined: 16 Oct 2012
Posts: 856
|
| Post: #1612 Posted: Tue Oct 29, 2013 10:20 am Post subject: Re: Lead Aluminium Crude backtest results |
|
|
| parva wrote: | Dear Rohan Sharmaji ..
I read your thread and want to know what are the gains every month using this strategy . Moreover I request you to post the strategy in a separate thread as I found it difficult to read as some changes I came across while reading it on different pages. Now it has more that 160 pages so quite difficult to find all finer point at one place.
Awaiting your reply .
Regards
Parva
P. S Please give results till now of Lead Aluminium and Crude . Thanks . |
This strategy has only Buy and Sell. No initial SL method incorporated. Simply if Super Trend Shows Buy (i.e. displays Red color), then BUY. If it shows Sell (i.e. displays Green Color), then SELL.
BUY SIGNAL:
Buy when price moves above Super-Trend (i.e. shows Red color). If you want, take double confirmation with EMA(64) above the prices on 30 min charts.
SELL SIGNAL:
Sell when price moves below Super-Trend (i.e. shows Green color). If you want take double confirmation with EMA(64)below the prices on 30 min charts.
Rules : wait for high or low to be taken out of first candle during gap against the position.
No trades on Saturday( any how trading has been closed on sat)
guideline:
wait for closing of 2nd candle to close above/previous the pre. candle closing
Profit Booking
I usually trade2 lots book 1 lot @ .30 paisa for metals and crude it from 25 point to 40 points depending on ATR and carry other lot till iget reversal..
Lead from jan to April it was average of 8 points a month and then may , august were exeption got more 15 points at that time and then june was average and July chopped the it by giving no substantial profit after the month. September a great month with around 20 points
Aluminium is usually half to 2/3rd of lead moves but it usually is slow.
Crude is so different every month i cannot say an average on this and frankly just started trading crude few months back and for start coupleof months i got around 300 points. August 1200 points that was again magical.. Then last month ended with loss of 92 points..
Hope this helps you..
Regards,
Rohan.
|
|
| Back to top |
|
|
mohitshukla2021
White Belt
Joined: 14 Feb 2012
Posts: 275
|
| Post: #1613 Posted: Tue Oct 29, 2013 9:04 pm Post subject: |
|
|
Rohan buddy !!
Crude ..in safe territory ??
or about to turn
|
|
| Back to top |
|
|
fanatictrader
White Belt
Joined: 31 Aug 2009
Posts: 15
|
| Post: #1614 Posted: Tue Oct 29, 2013 9:18 pm Post subject: |
|
|
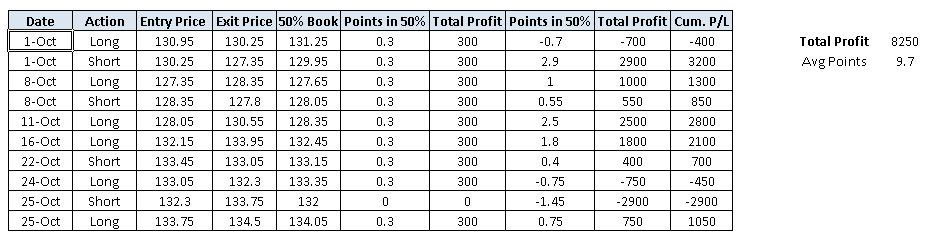
Nice thread ! Bumped into it yesterday and went through it. With numbers being put on the table it sounds a interesting setup.
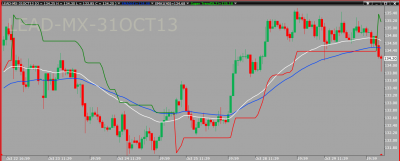
Just scanned through Lead Mini (MCX) for Month of October and it seems that if we go by rules as laid out, easy 9+ points so far 
Attached is the visual interpretation of signals so far in the current month. I am planning to start putting in some real cash starting next week.
I would try and come up similar logs for Zinc Mini as well.
[Content Edited by Admin]
| Description: |
|
| Filesize: |
8.46 KB |
| Viewed: |
837 Time(s) |
|
| Description: |
|
| Filesize: |
18.16 KB |
| Viewed: |
178 Time(s) |
|
|
|
| Back to top |
|
|
gopal_1438
White Belt
Joined: 24 Feb 2013
Posts: 223
|
| Post: #1615 Posted: Tue Oct 29, 2013 10:38 pm Post subject: |
|
|
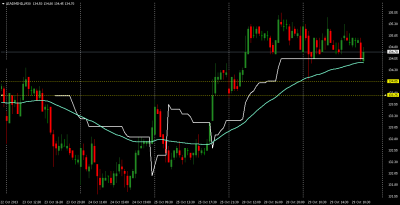
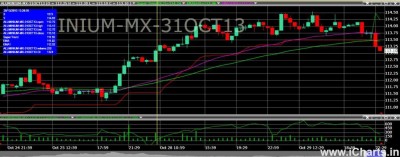
Alum & lead short triggered...pls confirm Rohanbhai
| Description: |
|
| Filesize: |
86.7 KB |
| Viewed: |
172 Time(s) |
|
|
|
| Back to top |
|
|
gopal_1438
White Belt
Joined: 24 Feb 2013
Posts: 223
|
| Post: #1616 Posted: Tue Oct 29, 2013 10:39 pm Post subject: |
|
|
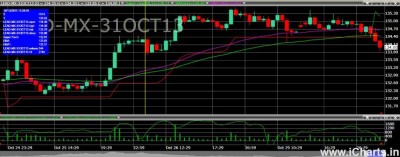
lead chart
| Description: |
|
| Filesize: |
81.82 KB |
| Viewed: |
177 Time(s) |
|
|
|
| Back to top |
|
|
rohan.sharma
Yellow Belt
Joined: 16 Oct 2012
Posts: 856
|
| Post: #1617 Posted: Tue Oct 29, 2013 10:41 pm Post subject: |
|
|
| gopal_1438 wrote: | | lead chart |
I have closed my long position in lead and alumium..
i have not taken short. in both.. crude long
|
|
| Back to top |
|
|
rohan.sharma
Yellow Belt
Joined: 16 Oct 2012
Posts: 856
|
|
| Back to top |
|
|
rohan.sharma
Yellow Belt
Joined: 16 Oct 2012
Posts: 856
|
|
| Back to top |
|
|
fanatictrader
White Belt
Joined: 31 Aug 2009
Posts: 15
|
| Post: #1620 Posted: Tue Oct 29, 2013 11:23 pm Post subject: |
|
|
| rohan.sharma wrote: | | fanatictrader wrote: | Nice thread ! Bumped into it yesterday and went through it. With numbers being put on the table it sounds a interesting setup.
Just scanned through Lead Mini (MCX) for Month of October and it seems that if we go by rules as laid out, easy 9+ points so far
Attached is the visual interpretation of signals so far in the current month. I am planning to start putting in some real cash starting next week.
I would try and come up similar logs for Zinc Mini as well. |
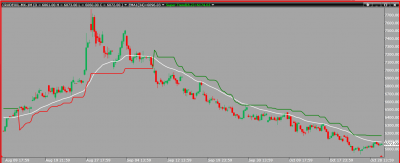
There two whips in the chart you have posted please go through the chart i have attached there are no whips..
I guess icharts has edge over other softwares which was mentioned earlier by natural gas
Nice presentation of testing... Parva was asking me about testing.. Hope you can backtest some more and provide with the results..
Thanks.. |
Thanks for the inputs Rohan. Really appreciate it. Parameters for ST which I have on charts posted in (10,3) vs (8,2) and hence this could be the difference.
As and when I get time, I would keep posting charts and updated results as well.
|
|
| Back to top |
|
|
|