| View previous topic :: View next topic |
| Author |
lead-alumini-crude |
rohan.sharma
Yellow Belt

Joined: 16 Oct 2012
Posts: 856
|
|
| Back to top |
|
 |
|
|
|
kingkrunal
White Belt

Joined: 22 Jun 2012
Posts: 498
|
Post: #2027  Posted: Wed Feb 19, 2014 5:00 pm Post subject: Posted: Wed Feb 19, 2014 5:00 pm Post subject: |
 |
|
| rohan.sharma wrote: | | kingkrunal wrote: | | rohan.sharma wrote: | | kingkrunal wrote: | | rohan.sharma wrote: | i am back in city will search for entry from monday....
 |
welcome back... pls post the charts bro...  there were few whips in my charting software there were few whips in my charting software |
|
thanks a lot for the chart... also few queries if you got time
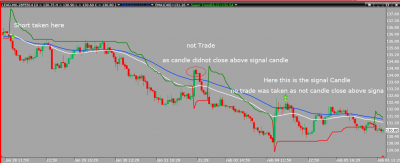
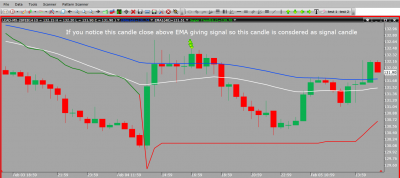
in the attached charts the 1st area marked along with arrow -- the long didnt trigger right as the high was not broken on closure basis.
and also the second arrow .. pls explain the trade when we opened the trade,.at the close of second candle 
ATTACHING THE CHARTS |
Please let me if you have any doubts.. |
So the rule is after any signal candle during any time of the day... we should wait for the next candle to close above the signal candle...
|
|
| Back to top |
|
|
kingkrunal
White Belt
Joined: 22 Jun 2012
Posts: 498
|
| Post: #2028 Posted: Wed Feb 19, 2014 5:03 pm Post subject: |
|
|
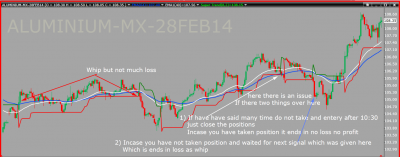
| rohan.sharma wrote: | | Current Status |
in this chart for alum... during last few trades there is a whip right ??? the buy signal was very fast as i can see... what is the amount for which it whipped in actual ?and how to handle this type of scenario.. basic rules only ???
|
|
| Back to top |
|
|
raj_jain1
White Belt
Joined: 14 Feb 2014
Posts: 63
|
| Post: #2029 Posted: Thu Feb 20, 2014 8:09 pm Post subject: |
|
|
| hello rohan sir can you plz give me 1 min. data of lead zinc and crude..i want it for backtesting purpose sir..it should be atleast 1 year....thanks in advance
|
|
| Back to top |
|
|
rohan.sharma
Yellow Belt
Joined: 16 Oct 2012
Posts: 856
|
| Post: #2030 Posted: Fri Feb 21, 2014 10:42 am Post subject: |
|
|
| kingkrunal wrote: | | rohan.sharma wrote: | | Current Status |
in this chart for alum... during last few trades there is a whip right ??? the buy signal was very fast as i can see... what is the amount for which it whipped in actual ?and how to handle this type of scenario.. basic rules only ??? |
| Description: |
|
| Filesize: |
136.07 KB |
| Viewed: |
426 Time(s) |
|
|
|
| Back to top |
|
|
rohan.sharma
Yellow Belt
Joined: 16 Oct 2012
Posts: 856
|
| Post: #2031 Posted: Fri Feb 21, 2014 11:54 am Post subject: |
|
|
| raj_jain1 wrote: | | hello rohan sir can you plz give me 1 min. data of lead zinc and crude..i want it for backtesting purpose sir..it should be atleast 1 year....thanks in advance |
I do not have that facility to give you data...
|
|
| Back to top |
|
|
kingkrunal
White Belt
Joined: 22 Jun 2012
Posts: 498
|
| Post: #2032 Posted: Fri Feb 21, 2014 1:35 pm Post subject: |
|
|
| rohan.sharma wrote: | | kingkrunal wrote: | | rohan.sharma wrote: | | Current Status |
in this chart for alum... during last few trades there is a whip right ??? the buy signal was very fast as i can see... what is the amount for which it whipped in actual ?and how to handle this type of scenario.. basic rules only ??? |
|
thanks for the great explanation ... and also the buy signal after the last whip... which was with a big SIGNAL CANDLE... so the trade will be done at the third candle close which closed above the SIGNAL CANDLE... am i correct ?
|
|
| Back to top |
|
|
raj_jain1
White Belt
Joined: 14 Feb 2014
Posts: 63
|
| Post: #2033 Posted: Sat Feb 22, 2014 8:52 pm Post subject: |
|
|
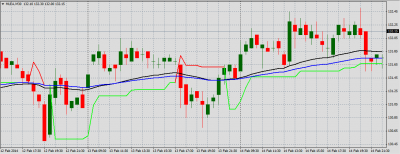
hello sir i am following your strategy..but as of nw i am on [REMOVED BY ADMIN] and tracking lead bt neither moving average nor supertrend indicator is showing same movements as your charts..so in supertrend indicator r u using different buffers like 0 and 1 are the target buffers, 0 is up trend buffer, 1 is downtred buffer.....and for moving average do you use any shifting parameters also???
because m using 8,2 for supertrend and 40 and 64 ema.... am attaching my [REMOVED BY ADMIN] chart of lead 30min. tf
| Description: |
|
| Filesize: |
40.08 KB |
| Viewed: |
359 Time(s) |
|
|
|
| Back to top |
|
|
rohan.sharma
Yellow Belt
Joined: 16 Oct 2012
Posts: 856
|
| Post: #2034 Posted: Mon Feb 24, 2014 11:52 am Post subject: |
|
|
| raj_jain1 wrote: | hello sir i am following your strategy..but as of nw i am on [REMOVED BY ADMIN] and tracking lead bt neither moving average nor supertrend indicator is showing same movements as your charts..so in supertrend indicator r u using different buffers like 0 and 1 are the target buffers, 0 is up trend buffer, 1 is downtred buffer.....and for moving average do you use any shifting parameters also???
because m using 8,2 for supertrend and 40 and 64 ema.... am attaching my [REMOVED BY ADMIN] chart of lead 30min. tf |
super trend from software to software it will change. Some use ATR to compute some use averages..and there is difference in every software..I have tried many softwares with super trend. I found Platinum charts of icharts to be the best... EMA depends on data you take. but usually there should not be much difference..
|
|
| Back to top |
|
|
rohan.sharma
Yellow Belt
Joined: 16 Oct 2012
Posts: 856
|
| Post: #2035 Posted: Mon Feb 24, 2014 11:54 am Post subject: |
|
|
| kingkrunal wrote: | | rohan.sharma wrote: | | kingkrunal wrote: | | rohan.sharma wrote: | | Current Status |
in this chart for alum... during last few trades there is a whip right ??? the buy signal was very fast as i can see... what is the amount for which it whipped in actual ?and how to handle this type of scenario.. basic rules only ??? |
|
thanks for the great explanation ... and also the buy signal after the last whip... which was with a big SIGNAL CANDLE... so the trade will be done at the third candle close which closed above the SIGNAL CANDLE... am i correct ? |
I did not get your point could you please show it on chart...
|
|
| Back to top |
|
|
kingkrunal
White Belt
Joined: 22 Jun 2012
Posts: 498
|
| Post: #2036 Posted: Mon Feb 24, 2014 1:06 pm Post subject: |
|
|
| rohan.sharma wrote: | | kingkrunal wrote: | | rohan.sharma wrote: | | kingkrunal wrote: | | rohan.sharma wrote: | | Current Status |
in this chart for alum... during last few trades there is a whip right ??? the buy signal was very fast as i can see... what is the amount for which it whipped in actual ?and how to handle this type of scenario.. basic rules only ??? |
|
thanks for the great explanation ... and also the buy signal after the last whip... which was with a big SIGNAL CANDLE... so the trade will be done at the third candle close which closed above the SIGNAL CANDLE... am i correct ? |
I did not get your point could you please show it on chart... |
ok the same aluminium chart which u posted... when does the last buy will be intiated ??? after the last explain whip trade ...
and one more doubt -- if we close the position after 10.30 then when to intiate the new trade next day?? i mean is there any conditions on that
|
|
| Back to top |
|
|
kingkrunal
White Belt
Joined: 22 Jun 2012
Posts: 498
|
| Post: #2037 Posted: Mon Feb 24, 2014 1:16 pm Post subject: |
|
|
| rohan.sharma wrote: | | kingkrunal wrote: | | rohan.sharma wrote: | | kingkrunal wrote: | | rohan.sharma wrote: | | Current Status |
in this chart for alum... during last few trades there is a whip right ??? the buy signal was very fast as i can see... what is the amount for which it whipped in actual ?and how to handle this type of scenario.. basic rules only ??? |
|
thanks for the great explanation ... and also the buy signal after the last whip... which was with a big SIGNAL CANDLE... so the trade will be done at the third candle close which closed above the SIGNAL CANDLE... am i correct ? |
I did not get your point could you please show it on chart... |
ok the same aluminium chart which u posted... when does the last buy will be intiated ??? after the last explain whip trade ...
and one more doubt -- if we close the position after 10.30 then when to intiate the new trade next day?? i mean is there any conditions on that
|
|
| Back to top |
|
|
raj_jain1
White Belt
Joined: 14 Feb 2014
Posts: 63
|
| Post: #2038 Posted: Mon Feb 24, 2014 4:07 pm Post subject: |
|
|
| can i take trial of platinum charts for only one day..for confirming that icharts have different supertrend...if i get similar movement as u posted then i will surely subscribe for that..what is the subscription charges??
|
|
| Back to top |
|
|
kamal.icharts
Site Admin
Joined: 10 Apr 2013
Posts: 576
|
| Post: #2039 Posted: Mon Feb 24, 2014 5:47 pm Post subject: |
|
|
Dear Raj,
Thanks for your interest in iCharts services. You can go for trial pack, details can be found at http://www.icharts.in/trial-pack.html
Thanks and Regards
Kamal
| raj_jain1 wrote: | | can i take trial of platinum charts for only one day..for confirming that icharts have different supertrend...if i get similar movement as u posted then i will surely subscribe for that..what is the subscription charges?? |
|
|
| Back to top |
|
|
D0407
White Belt
Joined: 14 Jun 2013
Posts: 87
|
| Post: #2040 Posted: Mon Feb 24, 2014 5:48 pm Post subject: |
|
|
| raj_jain1 wrote: | | can i take trial of platinum charts for only one day..for confirming that icharts have different supertrend...if i get similar movement as u posted then i will surely subscribe for that..what is the subscription charges?? |
raj_jain ji the ichart supertrend is really differnt from any other charting service i was using mt4 but was not able to modify supertrend according to ichart supertrend...for commodities its Rs1599 only
|
|
| Back to top |
|
|
|