| View previous topic :: View next topic |
| Author |
lead-alumini-crude |
UMESH0909
White Belt

Joined: 02 Jul 2013
Posts: 139
|
Post: #2056  Posted: Fri Feb 28, 2014 7:18 pm Post subject: Posted: Fri Feb 28, 2014 7:18 pm Post subject: |
 |
|
Dear rohan sir,
I am very new to commodity. I have gone through the whole thread and I got interested in commodity and subscribed to ichart.
I was going through lead and aluminium chart for understanding purpose.
You mentioned on 25th feb that for aluminium long was initiated on 18th feb based on the understanding of the rules i am seeing that then short should be initiated on 19th 1pm. then again long on 21st 4 pm.
Am I missing something? could you please give pointers on the chart for trade initiation and close for past few trade for both lead and aluminium then It will really help to understand the basics.
Thanks in advance.
|
|
| Back to top |
|
 |
|
|
|
UMESH0909
White Belt
Joined: 02 Jul 2013
Posts: 139
|
| Post: #2057 Posted: Fri Feb 28, 2014 8:14 pm Post subject: |
|
|
Dear rohan,
one more doubt I have that when to change the contract month because I have seen quite different charts in different contract months.
Thanks
|
|
| Back to top |
|
|
Rahulsharmaat
Black Belt

Joined: 04 Nov 2009
Posts: 2766
|
| Post: #2058 Posted: Sun Mar 02, 2014 10:55 am Post subject: |
|
|
please post rules...
i am still waiting
|
|
| Back to top |
|
|
kingkrunal
White Belt
Joined: 22 Jun 2012
Posts: 498
|
| Post: #2059 Posted: Sun Mar 02, 2014 12:45 pm Post subject: |
|
|
super trend 8,2 ema 64...
signal candle - st signal and close above ema
trade - any candle. close above signal candle..
day open - if in opposite direction wait for break of the opening candle to close the trade..and reverse
avoid any new trade after 10.30 pm.
|
|
| Back to top |
|
|
UMESH0909
White Belt
Joined: 02 Jul 2013
Posts: 139
|
| Post: #2060 Posted: Sun Mar 02, 2014 6:52 pm Post subject: |
|
|
dear kingkrunal
after 10:30 no trade is only valid only for initiation of the trade or for closing of the trade too, if reverse single comes.
thanks
|
|
| Back to top |
|
|
kingkrunal
White Belt
Joined: 22 Jun 2012
Posts: 498
|
| Post: #2061 Posted: Sun Mar 02, 2014 7:06 pm Post subject: |
|
|
| UMESH0909 wrote: | dear kingkrunal
after 10:30 no trade is only valid only for initiation of the trade or for closing of the trade too, if reverse single comes.
thanks |
its for everything... if signal comes close the opened trade and do not initiate a new one...
next follow the first candle rule and open the new trade
|
|
| Back to top |
|
|
Rahulsharmaat
Black Belt
Joined: 04 Nov 2009
Posts: 2766
|
| Post: #2062 Posted: Mon Mar 03, 2014 9:15 am Post subject: |
|
|
thanks
In case after signal candle--- few candle dosent close below or above it-- what should be do...
Example: on 30th dec- -signal candle closed at 109.90--next 7 candle dosent close below it-- and 8th candle closed at 109.60-- low of candle was--109 .40---which didnt broke in next 5 candle-- next day it broke 109.40--- so should be short next day---
should be see low /high of signal candle and next candle or any following candle close above signal candle high-- or just close above signal candle close-- and we take trade
pls explain
|
|
| Back to top |
|
|
mohitshukla2021
White Belt
Joined: 14 Feb 2012
Posts: 275
|
| Post: #2063 Posted: Mon Mar 03, 2014 3:02 pm Post subject: |
|
|
Welcome back Rahul 
I totally agree with your point that Crude is very volatile....I found Aluminium easy to trade and safer if you wish to avoid heavy volatility .
|
|
| Back to top |
|
|
Rahulsharmaat
Black Belt
Joined: 04 Nov 2009
Posts: 2766
|
| Post: #2064 Posted: Mon Mar 03, 2014 3:08 pm Post subject: |
|
|
| thanks Mr Shukla
|
|
| Back to top |
|
|
kingkrunal
White Belt
Joined: 22 Jun 2012
Posts: 498
|
| Post: #2065 Posted: Mon Mar 03, 2014 5:55 pm Post subject: |
|
|
| Rahulsharmaat wrote: | thanks
In case after signal candle--- few candle dosent close below or above it-- what should be do...
Example: on 30th dec- -signal candle closed at 109.90--next 7 candle dosent close below it-- and 8th candle closed at 109.60-- low of candle was--109 .40---which didnt broke in next 5 candle-- next day it broke 109.40--- so should be short next day---
should be see low /high of signal candle and next candle or any following candle close above signal candle high-- or just close above signal candle close-- and we take trade
pls explain |
A paragraph from rahuls post
This strategy has only Buy and Sell. No initial SL method incorporated. Simply if Super Trend Shows Buy (i.e. displays Red color), then BUY. If it shows Sell (i.e. displays Green Color), then SELL.
BUY SIGNAL:
Buy when price moves above Super-Trend (i.e. shows Red color). If you want, take double confirmation with EMA(64) above the prices on 30 min charts.
SELL SIGNAL:
Sell when price moves below Super-Trend (i.e. shows Green color). If you want take double confirmation with EMA(64)below the prices on 30 min charts.
Rules : wait for high or low to be taken out of first candle during gap against the position.
No trades on Saturday( any how trading has been closed on sat)
wait for closing of 2nd candle to close above/previous the pre. candle closing
Profit Booking
I usually trade2 lots book 1 lot @ .30 paisa for metals and crude it from 25 point to 40 points depending on ATR and carry other lot till iget reversal..
|
|
| Back to top |
|
|
UMESH0909
White Belt
Joined: 02 Jul 2013
Posts: 139
|
| Post: #2066 Posted: Tue Mar 04, 2014 2:15 pm Post subject: |
|
|
can anybody give the point tally for February, if possible for each trade.
I have back tested for February so wanted to confirm my understanding.
I have seen previous 1month continuous chart and 31st march expiry chart. Indicators looks different in both chart.
My question is which one should we use? if we use expiry month then when should we change the expiry month?(i.e approx how many days before expiry).
|
|
| Back to top |
|
|
raj_jain1
White Belt
Joined: 14 Feb 2014
Posts: 63
|
| Post: #2067 Posted: Wed Mar 05, 2014 1:42 pm Post subject: |
|
|
| kindly post the current status....of crude lead and aluminium..rohan bhaiiiiiiiiiiiiiii.....khaaaaannn hooooooooo.....
|
|
| Back to top |
|
|
rohan.sharma
Yellow Belt

Joined: 16 Oct 2012
Posts: 856
|
| Post: #2068 Posted: Wed Mar 05, 2014 2:04 pm Post subject: |
|
|
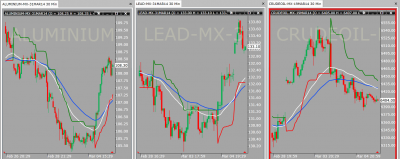
Current Status
| Description: |
|
| Filesize: |
168.45 KB |
| Viewed: |
426 Time(s) |
|
|
|
| Back to top |
|
|
rohan.sharma
Yellow Belt
Joined: 16 Oct 2012
Posts: 856
|
| Post: #2069 Posted: Wed Mar 05, 2014 2:09 pm Post subject: |
|
|
| UMESH0909 wrote: | can anybody give the point tally for February, if possible for each trade.
I have back tested for February so wanted to confirm my understanding.
I have seen previous 1month continuous chart and 31st march expiry chart. Indicators looks different in both chart.
My question is which one should we use? if we use expiry month then when should we change the expiry month?(i.e approx how many days before expiry). |
I use expiry based charts only not 1M/continuous charts.
Two conditions to change the contract :
a) if you get a new trade 3days ago or 2 days ago..
b) in case above condition does not satisfy first hour in case of expiry days in case of metals and last but 0ne day before the expiry for crude thats what i follow..
|
|
| Back to top |
|
|
UMESH0909
White Belt
Joined: 02 Jul 2013
Posts: 139
|
| Post: #2070 Posted: Wed Mar 05, 2014 2:21 pm Post subject: |
|
|
| Thanks rohan.sharma
|
|
| Back to top |
|
|
|


