|
|
| View previous topic :: View next topic |
| Author |
lead-alumini-crude |
rohan.sharma
Yellow Belt

Joined: 16 Oct 2012
Posts: 856
|
Post: #2206  Posted: Mon May 05, 2014 3:29 pm Post subject: Posted: Mon May 05, 2014 3:29 pm Post subject: |
 |
|
| Crude Bought @ 6045
|
|
| Back to top |
|
 |
|
| |
rohan.sharma
Yellow Belt
Joined: 16 Oct 2012
Posts: 856
|
| Post: #2207 Posted: Tue May 06, 2014 10:38 am Post subject: |
|
|
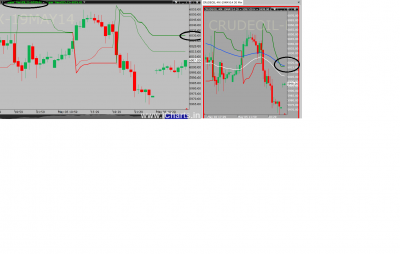
Current Status Longs in metal and short in crude
| Description: |
|
| Filesize: |
155.05 KB |
| Viewed: |
432 Time(s) |
|
|
|
| Back to top |
|
|
jacky75
White Belt

Joined: 19 Feb 2012
Posts: 47
|
| Post: #2208 Posted: Tue May 06, 2014 12:47 pm Post subject: crude |
|
|
| rohan.sharma wrote: | | Current Status Longs in metal and short in crude |
Setting of Crude seems to be ST(5,2) in the chart posted by you. ST(8,2) shows 6030.48 in my chart. 
|
|
| Back to top |
|
|
rohan.sharma
Yellow Belt
Joined: 16 Oct 2012
Posts: 856
|
| Post: #2209 Posted: Tue May 06, 2014 1:09 pm Post subject: Re: crude |
|
|
| jacky75 wrote: | | rohan.sharma wrote: | | Current Status Longs in metal and short in crude |
Setting of Crude seems to be ST(5,2) in the chart posted by you. ST(8,2) shows 6030.48 in my chart. |
I use 8,2 only for all the scripts..
|
|
| Back to top |
|
|
rohan.sharma
Yellow Belt
Joined: 16 Oct 2012
Posts: 856
|
| Post: #2210 Posted: Tue May 06, 2014 1:11 pm Post subject: |
|
|
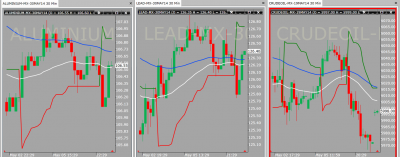
| rohan.sharma wrote: | | Current Status Longs in metal and short in crude |
Correction Long in lead, short in crude and alumi...
|
|
| Back to top |
|
|
jacky75
White Belt
Joined: 19 Feb 2012
Posts: 47
|
|
| Back to top |
|
|
rohan.sharma
Yellow Belt
Joined: 16 Oct 2012
Posts: 856
|
| Post: #2212 Posted: Tue May 06, 2014 7:09 pm Post subject: Re: crude |
|
|
| jacky75 wrote: | | rohan.sharma wrote: | | jacky75 wrote: | | rohan.sharma wrote: | | Current Status Longs in metal and short in crude |
Setting of Crude seems to be ST(5,2) in the chart posted by you. ST(8,2) shows 6030.48 in my chart. |
I use 8,2 only for all the scripts.. |
 |
PLease read the thread for for current 50 pages it is 8,2 and the same chart which you have plotted also shows 8,2 is better than 5,2
|
|
| Back to top |
|
|
jacky75
White Belt
Joined: 19 Feb 2012
Posts: 47
|
|
| Back to top |
|
|
rohan.sharma
Yellow Belt
Joined: 16 Oct 2012
Posts: 856
|
|
| Back to top |
|
|
rohan.sharma
Yellow Belt
Joined: 16 Oct 2012
Posts: 856
|
| Post: #2215 Posted: Wed May 07, 2014 12:57 pm Post subject: Re: crude |
|
|
| jacky75 wrote: | | rohan.sharma wrote: | | jacky75 wrote: | | rohan.sharma wrote: | | jacky75 wrote: | | rohan.sharma wrote: | | Current Status Longs in metal and short in crude |
Setting of Crude seems to be ST(5,2) in the chart posted by you. ST(8,2) shows 6030.48 in my chart. |
I use 8,2 only for all the scripts.. |
|
PLease read the thread for for current 50 pages it is 8,2 and the same chart which you have plotted also shows 8,2 is better than 5,2 |
rohanbhai please do not take it otherwise as I follow same setting for crude I could see different reading when you posted 3 in 1 charts. Reading of ST for Crude in the chart posted by you was around 6015~6016 and hence my post. However my ST was showing 6030.48. Please ignore my post if found irrelevent. |
Just make things more clear,, please check this post of December http://www.icharts.in/forum/lead-alumini-crude-t4986,postorder,desc,start,255.html where in the chart 8,2 is visible...
|
|
| Back to top |
|
|
raj_jain1
White Belt
Joined: 14 Feb 2014
Posts: 63
|
| Post: #2216 Posted: Wed May 07, 2014 7:57 pm Post subject: |
|
|
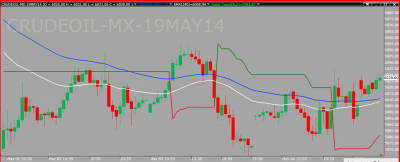
rohan sir in last crude entry in what basis u entered in crude..
because first signal candle formed above EMA and ST...then no candle close above it ...next day gap up opening above signal candle ...so here i am confused where to take entry??
signal candle basis??
gap up candle high basis?
or anything else??
| Description: |
|
| Filesize: |
41.67 KB |
| Viewed: |
386 Time(s) |
|
|
|
| Back to top |
|
|
rohan.sharma
Yellow Belt
Joined: 16 Oct 2012
Posts: 856
|
| Post: #2217 Posted: Thu May 08, 2014 10:05 am Post subject: |
|
|
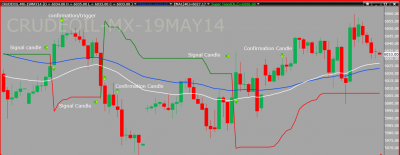
| raj_jain1 wrote: | rohan sir in last crude entry in what basis u entered in crude..
because first signal candle formed above EMA and ST...then no candle close above it ...next day gap up opening above signal candle ...so here i am confused where to take entry??
signal candle basis??
gap up candle high basis?
or anything else?? |
This strategy has only Buy and Sell. No initial SL method incorporated. Simply if Super Trend Shows Buy (i.e. displays Red color), then BUY. If it shows Sell (i.e. displays Green Color), then SELL.
BUY SIGNAL:
Buy when price moves above Super-Trend (i.e. shows Red color). If you want, take double confirmation with EMA(64) above the prices on 30 min charts.
SELL SIGNAL:
Sell when price moves below Super-Trend (i.e. shows Green color). If you want take double confirmation with EMA(64)below the prices on 30 min charts.
Rules : wait for high or low to be taken out of first candle during gap against the position.
wait for closing of 2nd candle to close above/previous the pre. candle closing, if it is during trading time.
| Description: |
|
| Filesize: |
110.63 KB |
| Viewed: |
446 Time(s) |
|
|
|
| Back to top |
|
|
rohan.sharma
Yellow Belt
Joined: 16 Oct 2012
Posts: 856
|
| Post: #2218 Posted: Thu May 08, 2014 10:07 am Post subject: |
|
|
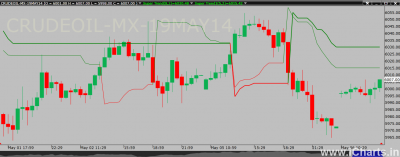
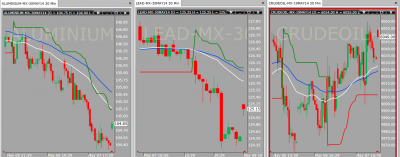
Current Status:
Metals are short and Crude long
| Description: |
|
| Filesize: |
151.42 KB |
| Viewed: |
390 Time(s) |
|
|
|
| Back to top |
|
|
jacky75
White Belt
Joined: 19 Feb 2012
Posts: 47
|
| Post: #2219 Posted: Thu May 08, 2014 6:42 pm Post subject: Re: crude |
|
|
| rohan.sharma wrote: | | jacky75 wrote: | | rohan.sharma wrote: | | jacky75 wrote: | | rohan.sharma wrote: | | jacky75 wrote: | | rohan.sharma wrote: | | Current Status Longs in metal and short in crude |
Setting of Crude seems to be ST(5,2) in the chart posted by you. ST(8,2) shows 6030.48 in my chart. |
I use 8,2 only for all the scripts.. |
|
PLease read the thread for for current 50 pages it is 8,2 and the same chart which you have plotted also shows 8,2 is better than 5,2 |
rohanbhai please do not take it otherwise as I follow same setting for crude I could see different reading when you posted 3 in 1 charts. Reading of ST for Crude in the chart posted by you was around 6015~6016 and hence my post. However my ST was showing 6030.48. Please ignore my post if found irrelevent. |
Just make things more clear,, please check this post of December http://www.icharts.in/forum/lead-alumini-crude-t4986,postorder,desc,start,255.html where in the chart 8,2 is visible... |
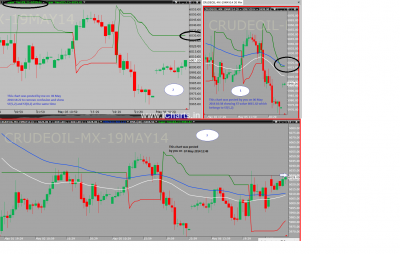
Only because you have asked to make things more clear I am attempting to do so; otherwise I have absolutely no interest to spend time on this issue and would like to declare that this is last post from me on this issue. There was a post from you on 6th May at 10:38 showing 3 charts. In that post the chart pertaining to Crude was indicating ST value as 6015.42; as such I tried to bring this fact to your notice. and posted a chart indicating ST(5,2) as well as ST(8,2) to make things more clear. However it seems it had created more confusion; some how. Please refer to the chart posted by me alongwith this post where in I have incorporated Crude chart posted by you on 7th May at 12:49 indicating correct Crude chart.
In other post while posting reply to me you have posted as detailed below -
QUOTE
Confusion is candle was not formed yet so ST was moving...so it showed that value..later when candles close in green it moved back...
I am using in 8,2 only...there is nothing to take otherwise...
UNQUOTE
This statement is not correct as bearish signal candle in case of ST(5.2) is 18:59:59 on 05-05-14 as seen in chart posted by you on 6th May at 10:38. However in case of ST(8,2) bearish signal candle is 19:29:59 on 05-05-14 in chart posted by you on 7th May at 12:49. This also can be seen in the chart posted by me incorporating both ST values in same chart.
If still things are not clear it is my failure that I am not able to explain issue / my view properly. I have no doubt in my mind that you use ST(8,2) values for trading. Let's concentrate on more important things than this. I am putting full stop to this issue with this post.
| Description: |
|
| Filesize: |
235.41 KB |
| Viewed: |
427 Time(s) |
|
|
|
| Back to top |
|
|
rohan.sharma
Yellow Belt
Joined: 16 Oct 2012
Posts: 856
|
| Post: #2220 Posted: Fri May 09, 2014 11:12 am Post subject: Re: crude |
|
|
| jacky75 wrote: | | rohan.sharma wrote: | | jacky75 wrote: | | rohan.sharma wrote: | | jacky75 wrote: | | rohan.sharma wrote: | | jacky75 wrote: | | rohan.sharma wrote: | | Current Status Longs in metal and short in crude |
Setting of Crude seems to be ST(5,2) in the chart posted by you. ST(8,2) shows 6030.48 in my chart. |
I use 8,2 only for all the scripts.. |
|
PLease read the thread for for current 50 pages it is 8,2 and the same chart which you have plotted also shows 8,2 is better than 5,2 |
rohanbhai please do not take it otherwise as I follow same setting for crude I could see different reading when you posted 3 in 1 charts. Reading of ST for Crude in the chart posted by you was around 6015~6016 and hence my post. However my ST was showing 6030.48. Please ignore my post if found irrelevent. |
Just make things more clear,, please check this post of December http://www.icharts.in/forum/lead-alumini-crude-t4986,postorder,desc,start,255.html where in the chart 8,2 is visible... |
Only because you have asked to make things more clear I am attempting to do so; otherwise I have absolutely no interest to spend time on this issue and would like to declare that this is last post from me on this issue. There was a post from you on 6th May at 10:38 showing 3 charts. In that post the chart pertaining to Crude was indicating ST value as 6015.42; as such I tried to bring this fact to your notice. and posted a chart indicating ST(5,2) as well as ST(8,2) to make things more clear. However it seems it had created more confusion; some how. Please refer to the chart posted by me alongwith this post where in I have incorporated Crude chart posted by you on 7th May at 12:49 indicating correct Crude chart.
In other post while posting reply to me you have posted as detailed below -
QUOTE
Confusion is candle was not formed yet so ST was moving...so it showed that value..later when candles close in green it moved back...
I am using in 8,2 only...there is nothing to take otherwise...
UNQUOTE
This statement is not correct as bearish signal candle in case of ST(5.2) is 18:59:59 on 05-05-14 as seen in chart posted by you on 6th May at 10:38. However in case of ST(8,2) bearish signal candle is 19:29:59 on 05-05-14 in chart posted by you on 7th May at 12:49. This also can be seen in the chart posted by me incorporating both ST values in same chart.
If still things are not clear it is my failure that I am not able to explain issue / my view properly. I have no doubt in my mind that you use ST(8,2) values for trading. Let's concentrate on more important things than this. I am putting full stop to this issue with this post. |
Jacky frankly i also am not sure what exactly happened..
what happens when new low is formed ST lines comes down. but when candle is not able to close above the ST line moves upside..
initially i thought might have happend..
but now i think by mistake i might posted with 5,2 charts... sorry for the confusion...
|
|
| Back to top |
|
|
|
|
You cannot post new topics in this forum
You cannot reply to topics in this forum
You cannot edit your posts in this forum
You cannot delete your posts in this forum
You cannot vote in polls in this forum
You can attach files in this forum
You can download files in this forum
|
Powered by phpBB © 2001, 2005 phpBB Group
|
|
|