| View previous topic :: View next topic |
| Author |
Learning the Elliott Waves is difficult but not impossible |
chennuru
White Belt

Joined: 07 Jan 2011
Posts: 93
|
Post: #91  Posted: Fri Feb 13, 2015 9:57 pm Post subject: HUL shows bullish Posted: Fri Feb 13, 2015 9:57 pm Post subject: HUL shows bullish |
 |
|
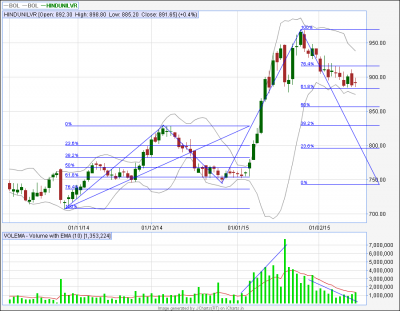
HUL charts shows good strength, 5 th wave above to start, target ----once again cross the recent all time high, good sign, volumes got trimmed during 4 th wave.
| Description: |
|
| Filesize: |
44.61 KB |
| Viewed: |
629 Time(s) |

|
|
|
| Back to top |
|
 |
|
|  |
chennuru
White Belt

Joined: 07 Jan 2011
Posts: 93
|
Post: #92  Posted: Fri Feb 27, 2015 5:12 pm Post subject: nif, consolidation, trending, intraday-27th Posted: Fri Feb 27, 2015 5:12 pm Post subject: nif, consolidation, trending, intraday-27th |
 |
|
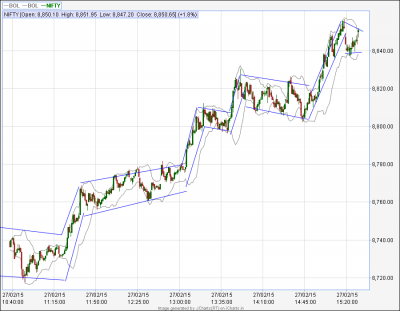
nifty, consolidation, trending, intraday-27th
| Description: |
|
| Filesize: |
46.8 KB |
| Viewed: |
584 Time(s) |

|
|
|
| Back to top |
|
 |
chennuru
White Belt

Joined: 07 Jan 2011
Posts: 93
|
Post: #93  Posted: Sat Mar 14, 2015 1:40 pm Post subject: Hourly and Daily Charts-Nifty Posted: Sat Mar 14, 2015 1:40 pm Post subject: Hourly and Daily Charts-Nifty |
 |
|
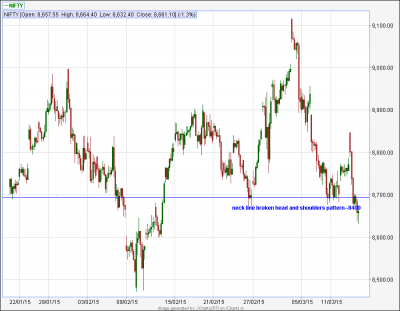
On the hourly charts Nifty is in down move in a lower top and lower bottom fashion. Moreover it has broken below the right shoulder of a bearish Hand & Shoulder pattern --target as low as 8400.
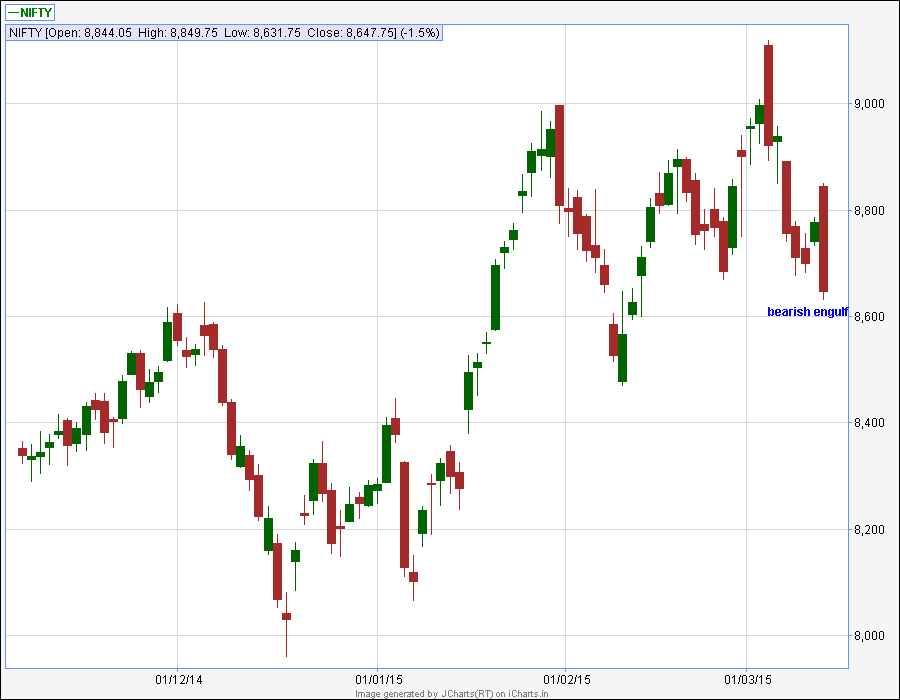
On the daily charts Nifty has made a bearish engulfing candle , engulfed price range of previous 3 sessions with its big range of 218 points today. it has broken and closed below the previous swing low of 8669. After a narrow range of 12-3-2105 , this down move energizes the bearishness for many traders. this market now become a sell on rallies market.
| Description: |
|
| Filesize: |
11.41 KB |
| Viewed: |
1570 Time(s) |

|
| Description: |
|
| Filesize: |
15.97 KB |
| Viewed: |
633 Time(s) |

|
|
|
| Back to top |
|
 |
amitagg
Black Belt

Joined: 01 Oct 2013
Posts: 4559
|
Post: #94  Posted: Sun Mar 15, 2015 11:09 am Post subject: Posted: Sun Mar 15, 2015 11:09 am Post subject: |
 |
|
Elliot Wave. Com has opened FREE videos window on major currencies commodities and bond all time frame analysis till March 17
Get a bigger picture and make this use of opportunity which is otherwise available for pros and institutions only on subscription
|
|
| Back to top |
|
 |
|
|
You cannot post new topics in this forum
You cannot reply to topics in this forum
You cannot edit your posts in this forum
You cannot delete your posts in this forum
You cannot vote in polls in this forum
You can attach files in this forum
You can download files in this forum
|
Powered by phpBB © 2001, 2005 phpBB Group
|
|

