| View previous topic :: View next topic |
| Author |
MACD/RSI/ADX based strategy |
sumesh_sol
Brown Belt

Joined: 06 Jun 2010
Posts: 2344
|
Post: #1  Posted: Fri Jan 30, 2015 4:01 pm Post subject: MACD/RSI/ADX based strategy Posted: Fri Jan 30, 2015 4:01 pm Post subject: MACD/RSI/ADX based strategy |
 |
|
Dear Friends,
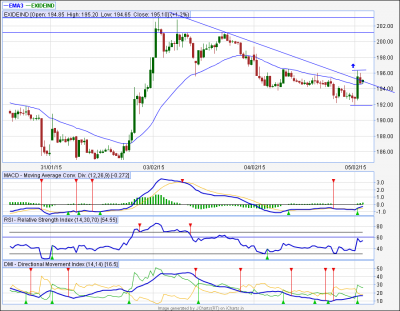
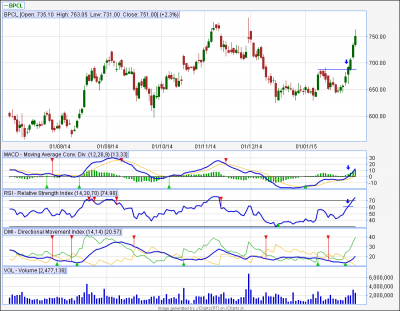
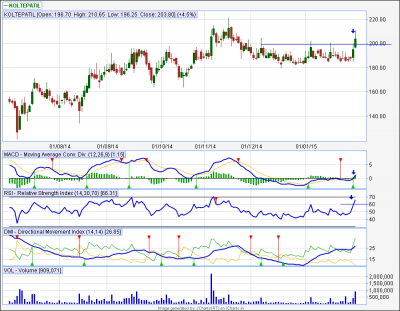
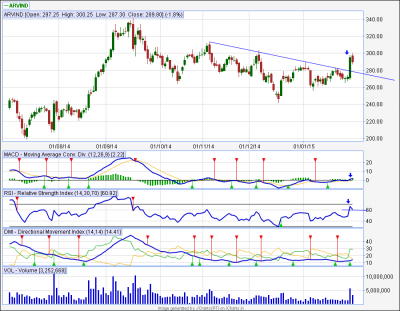
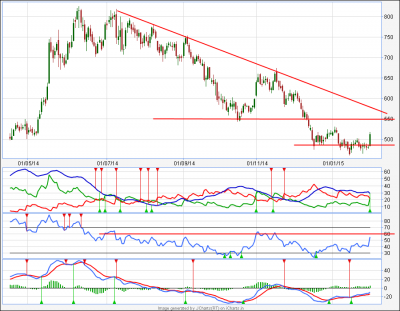
Yesterday while talking to Ramesh Raja sir in sb , he mentioned a kind of setup he uses alongwith this Gann study. As such I've no idea of Gann system, hence I tried to collect whatever I could understand during that small conversation. Following are my observations (for long trade, short can be reversed):
1.)Price retraced and consolidating in a clear uptrend.
2.)A breakout kind of candle happens
3.) At this time if MACD line crossed zero line from below giving buy signal + RSI above 60 , then it is a buy. Price will accelerate when ADX becomes bullish ( ADX >25).
4.) For target Fibonacci numbers can be used. SL/TSL is yet not clear to me.
I'm enclosing some examples here and requesting RR sir to enlighten us by correcting and advising wherever required.
This is just a pointer and no way a complete strategy. Just to initiate discussion on his method.
| Description: |
|
| Filesize: |
42.96 KB |
| Viewed: |
897 Time(s) |
|
| Description: |
|
| Filesize: |
43.24 KB |
| Viewed: |
675 Time(s) |
|
| Description: |
|
| Filesize: |
43.5 KB |
| Viewed: |
670 Time(s) |
|
|
|
| Back to top |
|
 |
|
|
|
nelson soibam
White Belt

Joined: 03 Jan 2015
Posts: 34
|
| Post: #2 Posted: Sun Feb 01, 2015 12:15 pm Post subject: |
|
|
hai sumesh
is this relience ifra wait 2/3 days for long under this observation.
with regards
| Description: |
|
| Filesize: |
47.22 KB |
| Viewed: |
614 Time(s) |
|
|
|
| Back to top |
|
|
rameshraja
Expert

Joined: 24 Nov 2006
Posts: 1121
|
| Post: #3 Posted: Mon Feb 02, 2015 7:03 am Post subject: |
|
|
Mr Sumesh
you are perfect in understanding how I go about to takeup trade.. I use this setup when I get buy and or sell signal as per Gann..
|
|
| Back to top |
|
|
baldewa
White Belt
Joined: 07 Nov 2010
Posts: 96
|
| Post: #4 Posted: Tue Feb 03, 2015 8:06 pm Post subject: |
|
|
| i hear about of gann by rr, there was sale on 30jan of high ofnifty ,as per time calculation, can you please explain.
|
|
| Back to top |
|
|
zeeshandangra
White Belt
Joined: 04 Nov 2014
Posts: 2
|
| Post: #5 Posted: Wed Feb 04, 2015 12:36 am Post subject: |
|
|
To Ramesh
I would highly appreciate if you can explain Gann method application. I know basics about Gann.
Kindly post.
|
|
| Back to top |
|
|
rameshraja
Expert
Joined: 24 Nov 2006
Posts: 1121
|
| Post: #6 Posted: Wed Feb 04, 2015 4:26 pm Post subject: |
|
|
| Gann methods cannot be explained in a single post.. I am still a student of gann and not well versed with the system
|
|
| Back to top |
|
|
sumesh_sol
Brown Belt
Joined: 06 Jun 2010
Posts: 2344
|
| Post: #7 Posted: Wed Feb 04, 2015 5:30 pm Post subject: MTNL..eod |
|
|
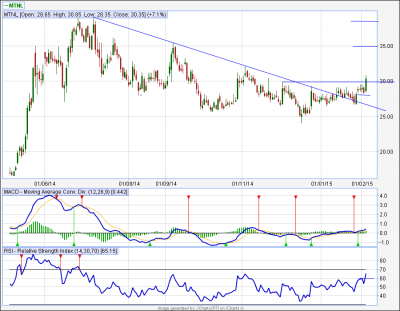
MTNL..eod
=========
This looks like a buy on account of following:
1.) Divergence on MACD at bottom (25 level)
2.) Breakout from trendline, and then from a consolidation of 02 months.
3.)RSI crossed above 60, MACD line above zero showing bullish signs.
It should be a buy (LTP-30.35) with a SL of 28 on closing basis. Target could be 35/38..
These are all my assumptions, RR sir may correct me if I'm wrong.
Regards,
| Description: |
|
| Filesize: |
38.45 KB |
| Viewed: |
605 Time(s) |
|
|
|
| Back to top |
|
|
rameshraja
Expert
Joined: 24 Nov 2006
Posts: 1121
|
| Post: #8 Posted: Wed Feb 04, 2015 6:57 pm Post subject: |
|
|
Mr Sumesh
MTNL perfect setup.. Could move as per your analysis.. As of now ADX is dead.. When its above 25, momentum could pickup.
|
|
| Back to top |
|
|
sumesh_sol
Brown Belt
Joined: 06 Jun 2010
Posts: 2344
|
| Post: #9 Posted: Wed Feb 04, 2015 7:45 pm Post subject: |
|
|
| rameshraja wrote: | Mr Sumesh
MTNL perfect setup.. Could move as per your analysis.. As of now ADX is dead.. When its above 25, momentum could pickup. |
Thanks a lot sir for your confirmation.. For us your Advice acts as additional indicator .
|
|
| Back to top |
|
|
sumesh_sol
Brown Belt
Joined: 06 Jun 2010
Posts: 2344
|
| Post: #10 Posted: Thu Feb 05, 2015 9:07 am Post subject: ONGC...eod |
|
|
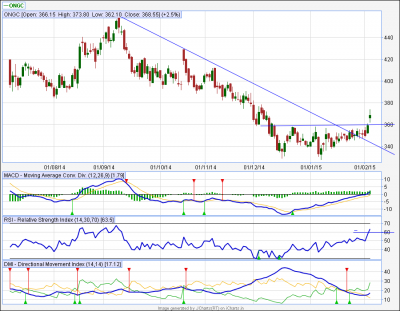
ONGC...eod
==========
Similar setup..
| Description: |
|
| Filesize: |
46.74 KB |
| Viewed: |
570 Time(s) |
|
|
|
| Back to top |
|
|
pkholla
Black Belt

Joined: 04 Nov 2010
Posts: 2890
|
| Post: #11 Posted: Thu Feb 05, 2015 9:28 am Post subject: Re: MACD/RSI/ADX based strategy |
|
|
| sumesh_sol wrote: | | Price will accelerate when ADX becomes bullish ( ADX >25). |
Sumesh: One small correction to your excellent post.
ADX is a trend indicator. ADX is sign-less (like absolute number in maths). It is an average derived from two basic indicators, DM+ and DM-.
When ADX rises above 25, this indicates the trend is becoming strong. Above ADX= 50 the trend is very strong and a peak often indicates likelihood of trend change
ADX itself is not bullish or bearish (DM+ is bullish and DM- is bearish)
Please search for and DL a book by Dr Charles Schaap on ADX based trading
Prakash Holla
Last edited by pkholla on Thu Feb 05, 2015 2:52 pm; edited 1 time in total |
|
| Back to top |
|
|
sumesh_sol
Brown Belt
Joined: 06 Jun 2010
Posts: 2344
|
|
| Back to top |
|
|
harinderpal
White Belt
Joined: 21 Jan 2010
Posts: 42
|
| Post: #13 Posted: Thu Feb 05, 2015 10:21 am Post subject: |
|
|
dear sumesh / rr sir , shouldn't we enter trade when rsi makes consequitive higher highs above 60. as we know 60 level is a resistance level and more often prices often touch and reverse from this level.
pls guide
|
|
| Back to top |
|
|
falcon
White Belt
Joined: 17 Nov 2011
Posts: 211
|
| Post: #14 Posted: Thu Feb 05, 2015 11:55 am Post subject: Re: MTNL..eod |
|
|
Sumesh,
Also note that for MTNL, weekly MACD gave a buy signal yesterday.
Regards
falcon
| sumesh_sol wrote: | MTNL..eod
=========
This looks like a buy on account of following:
1.) Divergence on MACD at bottom (25 level)
2.) Breakout from trendline, and then from a consolidation of 02 months.
3.)RSI crossed above 60, MACD line above zero showing bullish signs.
It should be a buy (LTP-30.35) with a SL of 28 on closing basis. Target could be 35/38..
These are all my assumptions, RR sir may correct me if I'm wrong.
Regards, |
|
|
| Back to top |
|
|
rameshraja
Expert
Joined: 24 Nov 2006
Posts: 1121
|
| Post: #15 Posted: Thu Feb 05, 2015 6:31 pm Post subject: |
|
|
Mr Sumesh
You are picking the stocks where MACD crossing Zero from below and RSI above 60.. High probable trade setup is taking ADX into consideration.. When it moves above 25, then momentum to your buy signal will accelerate.
Very Importantly, first you have to decide about the trend of market by using 50,200 crossover in Daily chart. If crossover is in buy mode and when market corrects and then begin to moveup again, the above setup can have high probable trades.
In Bull market, when 50, 200 crossover is in buy, the instrument tend to pullback to 50 average and thats the place you need to watch the above setup to takeup trades.
Today, thats the reason I told you about Tata Sponge in SB, just don't look at MACD and RSI alone as averages are not in perfect buy mode.. So too ONGC..
Trust this helps you..
|
|
| Back to top |
|
|
|