| View previous topic :: View next topic |
| Author |
Monthly pivot values |
vvsp
White Belt

Joined: 10 Nov 2010
Posts: 62
|
Post: #1  Posted: Fri Apr 22, 2011 1:41 pm Post subject: Monthly pivot values Posted: Fri Apr 22, 2011 1:41 pm Post subject: Monthly pivot values |
 |
|
The monthly pivot values displayed in daily chart and intraday charts are different.
To quote an example, ACC's monthly pivot in daily tf is 1049.25 and in 60 min TF it is 1073.83.
Shouldn't it be the same in all time frames?
Thanks,
Prabhakar.
|
|
| Back to top |
|
 |
|
|
|
ProTrader
Site Admin

Joined: 06 Jul 2008
Posts: 433
|
| Post: #2 Posted: Fri Apr 22, 2011 10:08 pm Post subject: |
|
|
Dear Prabhakar:
The intraday closing is different from EOD closing (adjusted close). This is the reason why the values will differ.
Thanks
--PT
|
|
| Back to top |
|
|
sunrays
White Belt
Joined: 19 Dec 2009
Posts: 71
|
| Post: #3 Posted: Fri Apr 22, 2011 11:54 pm Post subject: PP |
|
|
Dear PT sir
Pivots r predefined .How come the monthly pivots change even if the price fluctuates on an intraday basis..Dont they have to be the same
Thanks in advance 
Regards
Sun
|
|
| Back to top |
|
|
drsureshbs
White Belt
Joined: 22 Oct 2008
Posts: 58
|
| Post: #4 Posted: Sat Apr 23, 2011 12:10 am Post subject: |
|
|
PT sir
the pivot values change with the change in number of days data used in the charts.. which is the correct one.I am talking of intraday charts anddiff time frame and diff numer of days pl clarify
Thank you
|
|
| Back to top |
|
|
ProTrader
Site Admin
Joined: 06 Jul 2008
Posts: 433
|
| Post: #5 Posted: Sat Apr 23, 2011 8:22 am Post subject: |
|
|
Dear Morning Cold, Afternoon Hot Sunrays:
They are not predefined on the chart. They are calculated on demand when you click on the piv/pvt button so you see the values accordingly.
Thanks,
--PT
Dear drsureshbs:
They are all right based on what you want to see. But if you are looking for daily pivot values. Switch to Daily charts or use the one given below the charts. As mentioned, on an intra day chart, the values are based on intra day open, high, close and work well.
The Arbitary option, when you click PIV/PTS is if you want to calculate for an arbitrary number of days. Ignore it, unless you have some magic or lucky number that works for you. 
Thanks,
--PT
|
|
| Back to top |
|
|
vvsp
White Belt
Joined: 10 Nov 2010
Posts: 62
|
| Post: #6 Posted: Sat Apr 23, 2011 12:21 pm Post subject: |
|
|
| ProTrader wrote: | Dear Prabhakar:
The intraday closing is different from EOD closing (adjusted close). This is the reason why the values will differ.
Thanks
--PT |
Dear PT,
Thanks for the reply.
As I understand, monthly pivot is calculated from previous month's high, low and close values with the formula, Pivot = (High+Low+Close)/3.
For ACC,to obtain the value of April month's pivot,
in daily chart,
High = 1099 on 31/03
Low = 974.2 on 01/03
Close = 1074.55.
Pivot = (1099+974.2+1074.55)/3 = 1049.25. The same value is displayed in daily chart.
in 60 min chart,
High = 1098.9 on 31/03 in 13:00 candle
Low = 969.35 on 01/03 in 10:00 candle
Close = 1079.4
Pivot = (1098.9+969.35+1079.4)/3 = 1049.22.
When the time frame settings are changed to show intraday chart from 01/03 or prior date, the correct value of monthly pivot, 1049.22, is displayed.
If the timeframe settings are varied to show intraday chart for lesser no.of days, the value changes with no.of days chosen. For example,
When 15 days is chosen, the value is 1073.83
When 20 days is chosen, the value is 1065.33
I think whatever the timeframe settings are, the monthly pivot should be 1049.22 in intraday charts.
Thank you,
Prabhakar.
|
|
| Back to top |
|
|
ProTrader
Site Admin
Joined: 06 Jul 2008
Posts: 433
|
| Post: #7 Posted: Sat Apr 23, 2011 8:59 pm Post subject: |
|
|
Dear Prabhakar:
What you say is correct. But considering pivots like just any indicator, it is limited by the actual data on the chart and is calculated just in time.
In my view this is not significant as I (it could differ for others) as a trader is not looking for mathematical precision but more for the range. If I am trading based on intraday charts, then using the close of intra is fine as that is the actual traded close and I am not looking from a long term prespective. If my trades are positional then daily or higher range is fine, which has an adjusted close. Again this is only my view.
We will try and see if we can give the values below the chart for weekly and monthly pivots based on eod values.
Regards,
PT
|
|
| Back to top |
|
|
drsureshbs
White Belt
Joined: 22 Oct 2008
Posts: 58
|
| Post: #8 Posted: Sun Apr 24, 2011 12:13 am Post subject: |
|
|
Dear pt thank u for the reply I think my doubt is same as that of VVSP he has explained perfectly.is there any fixed no,0fdays to b used to get a correct plotting of pivots in intraday charts pl clarify
Thank you
|
|
| Back to top |
|
|
vvsp
White Belt
Joined: 10 Nov 2010
Posts: 62
|
| Post: #9 Posted: Sun Apr 24, 2011 11:45 am Post subject: |
|
|
| ProTrader wrote: | Dear Prabhakar:
What you say is correct. But considering pivots like just any indicator, it is limited by the actual data on the chart and is calculated just in time.
In my view this is not significant as I (it could differ for others) as a trader is not looking for mathematical precision but more for the range. If I am trading based on intraday charts, then using the close of intra is fine as that is the actual traded close and I am not looking from a long term prespective. If my trades are positional then daily or higher range is fine, which has an adjusted close. Again this is only my view.
We will try and see if we can give the values below the chart for weekly and monthly pivots based on eod values.
Regards,
PT |
Dear PT,
Thanks for the reply.
I just wanted to bring to your notice that, when the monthly pivot is calculated from intraday charts and from EOD charts,the difference is minute. For ACC, it is just 0.03.
I too look for the range and not the mathematical precision. But the range itself depends on the actual value.
For me, monthly pivot has a fixed value for the month in consideration and cannot change with the amount of data displayed in the chart.
Hereafter, I shall make a note or draw a horizontal line on the intraday chart at the pivot value, instead of relying on what the chart displays.
I think we can end the discussion here.
Thanks once again.
Prabhakar.
|
|
| Back to top |
|
|
jitesh7
White Belt
Joined: 24 Dec 2009
Posts: 24
|
| Post: #10 Posted: Sat Sep 15, 2012 4:46 pm Post subject: |
|
|
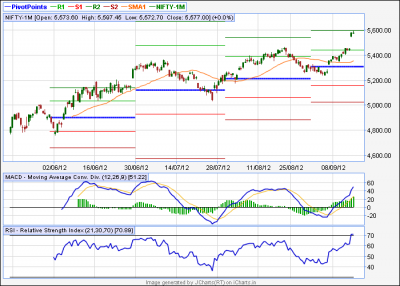
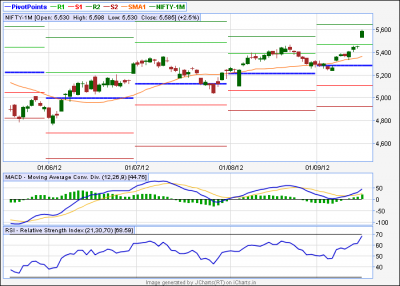
This problem is still there.. in case of Nifty difference is major. request you to please look in to it.
| Description: |
| monthly pivot with 4 hr candle |
|
| Filesize: |
22.82 KB |
| Viewed: |
496 Time(s) |
|
| Description: |
| Monthy Pivot with daily candle |
|
| Filesize: |
21.25 KB |
| Viewed: |
510 Time(s) |
|
|
|
| Back to top |
|
|
kamal.icharts
Site Admin
Joined: 10 Apr 2013
Posts: 576
|
| Post: #11 Posted: Sun Sep 16, 2012 8:34 pm Post subject: |
|
|
Dear Member,
The pivots are calculated based on the prices, as mentioned earlier by PT. For intraday timeframe from 30 sec to 4 hours, it will take the intraday prices for calculations, and for Daily / Weekly, it takes the Daily / weekly prices. Intraday prices sometime may differ slightly from the Daily prices and hence there will be difference in calculation. For actual values, please refer the monthly pivots plotted on Daily or Weekly.
Regards
Kamal
| jitesh7 wrote: | | This problem is still there.. in case of Nifty difference is major. request you to please look in to it. |
|
|
| Back to top |
|
|
|


