| View previous topic :: View next topic |
| Author |
MTT System Discussion - Sep 2011 |
SwingTrader
Site Admin
Joined: 11 Aug 2006
Posts: 2903
Location: Hyderabad, India
|
Post: #46  Posted: Sun Aug 21, 2011 11:47 pm Post subject: Posted: Sun Aug 21, 2011 11:47 pm Post subject: |
 |
|
| EMAMIT wrote: | Sir, I am attaching two charts of NIFTY FUTURES 19-Aug-2011 for 15 Minutes Time Frame and 5 Minutes Time Frame
Am I rightly identified the set up, trade, initial SL and Trailing SL
Few clarification needed from you
You mentioned WMA but at some other place mentioned EMA?
What is the use of EMA5/SMA13 combination in lower time frame? |
1. The initial SL would be moved down to 4882 or so only when the 10:55 swing low is broken at 11:15. Trailing SLs would be moved down (while short) only when a new low happens and vice versa for longs.
2. Similarly the TSL would be moved down again to around 4874 after the 11:25 swing low is broken to the downside by the 13:10 bar.
3. The first short you indicated is correct but SH1 and SH2 you indicated are not right. CCI has to hit +100 and then fall back below 0 for the short trigger. The other short signals were on 11:55, 12:20, 12:40, 13:05, 13:40 & 14:05 bars. Further shorts would be initialised only if one is not already short. The late you initiate your short/long the greater the risk.
4. WMA is on the higher timeframe only. EMA5/SMA13 are on lower timeframe for reversal trades triggers, you have not identified those on this chart. On 15 mins chart STS went oversold 13:45 onwards and one would start looking for a bullish reversal from that point onwards on the 5 mins chart. A long reversal trade would be triggred when EMA5 would crossover above SMA13 which happened on close of 14:35 bar.
Will post chart examples tomm to make things more clear....
_________________
Srikanth Kurdukar
@SwingTrader |
|
| Back to top |
|
 |
|
|
|
SwingTrader
Site Admin
Joined: 11 Aug 2006
Posts: 2903
Location: Hyderabad, India
|
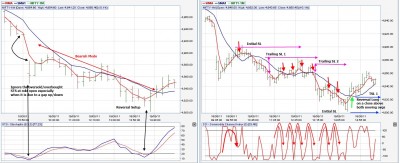
| Post: #47 Posted: Mon Aug 22, 2011 8:38 am Post subject: MTT example for 19.08.2011 |
|
|
I have attached NF charts for 19.08.2011 with relevant indications. Do note that one will be taking all the shorts indicated there. Only the earliest one will be taken and then the trade would be managed by moving the trailing stop loss. The other short signals can be used if the first one is missed but it is suggested that the earliest 1st or 2nd signals are low risk, after that for subsequent signals the risk increases.
Also note that there is one more short signal on the 14:40 PM bar that I have not indicated. I did not indicate it because on 15 mins chart STS had indicated the oversold setup so short is not permitted there.
Will continue to post examples...watch out for the charts for the worst case scenarios because those are the days when one has to manage the trades well. If losses can be contained on those days then the better days will more than take care of the profits. Worst case days are my favorite days...I concentrate on those days the most for testing strategies.
| Description: |
|
| Filesize: |
266.15 KB |
| Viewed: |
540 Time(s) |
|
_________________
Srikanth Kurdukar
@SwingTrader |
|
| Back to top |
|
|
SwingTrader
Site Admin
Joined: 11 Aug 2006
Posts: 2903
Location: Hyderabad, India
|
| Post: #48 Posted: Mon Aug 22, 2011 8:44 am Post subject: |
|
|
IMPORTANT CHANGE:
Please check the system rules again, I have fixed a mistake. The EMAs in the system are actual WMAs. I have fixed it in the system rules post below.
_________________
Srikanth Kurdukar
@SwingTrader |
|
| Back to top |
|
|
SwingTrader
Site Admin
Joined: 11 Aug 2006
Posts: 2903
Location: Hyderabad, India
|
| Post: #49 Posted: Mon Aug 22, 2011 11:08 am Post subject: |
|
|
Today is a good example of a difficult day for the system...at least until now.
1. STS was overbought at mkt open but as I mentioned on the chart, reversal trades are best avoided at mkt open.
2. Since STS was overbought the long trade triggered at 9:35 would have to be ignored (if it would have been taken we would have had to reverse it for a loss when the reversal to short was triggered at 10:30)
3. Now as of 11:05 STS on 15 mins is oversold and we are looking at a bullish reversal (further shorts would be ignore at this point as STS is oversold).
_________________
Srikanth Kurdukar
@SwingTrader |
|
| Back to top |
|
|
SwingTrader
Site Admin
Joined: 11 Aug 2006
Posts: 2903
Location: Hyderabad, India
|
| Post: #50 Posted: Mon Aug 22, 2011 1:09 pm Post subject: |
|
|
Today is the 3rd day in August 2011 which is difficult to trade using the MTT system. The other days were 3rd & 10th Aug. Today the day's range is okay but SLs are wide so one is having to keep wide stops or skip taking the trade. I guess most short-term trend following methods would be facing this issue (unless, of course, the trader is willing to drop down to lower timeframes like 10 min + 3 min combo...of course these combos will have other issues to deal with).
I will later post charts for 3rd & 10th and will also post charts for few good days to give an idea of what is possible with this system.
_________________
Srikanth Kurdukar
@SwingTrader |
|
| Back to top |
|
|
girishhu1
White Belt

Joined: 17 Aug 2009
Posts: 316
|
| Post: #51 Posted: Mon Aug 22, 2011 3:57 pm Post subject: |
|
|
hellow st sir,
what should be the timeframe setting- i mean 3 days, 5 days etcetc.? i have noted that the setting influence the moving averages.
regards,
girish
|
|
| Back to top |
|
|
SwingTrader
Site Admin
Joined: 11 Aug 2006
Posts: 2903
Location: Hyderabad, India
|
| Post: #52 Posted: Mon Aug 22, 2011 8:49 pm Post subject: |
|
|
| girishhu1 wrote: | hellow st sir,
what should be the timeframe setting- i mean 3 days, 5 days etcetc.? i have noted that the setting influence the moving averages.
regards,
girish |
Set it to 20-30 days, it should be enough. Yes, WMA & EMA are sensitive to the number of days of data loaded. The more you load the more accurate the values. The WMA periods we are using are small so around 20 days and above should be more than enough.
_________________
Srikanth Kurdukar
@SwingTrader |
|
| Back to top |
|
|
SwingTrader
Site Admin
Joined: 11 Aug 2006
Posts: 2903
Location: Hyderabad, India
|
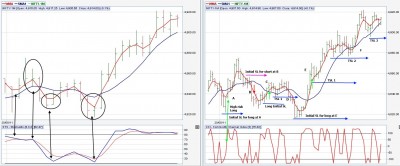
| Post: #53 Posted: Mon Aug 22, 2011 9:38 pm Post subject: MTT - NF - 22.08.2011 |
|
|
Today's MTT chart for NF
A/B/C etc below refer to markings on the chart.
OB - Overbought
OS - Oversold
HTF - Higher Timeframe
LTF - Lower Timeframe
ISL - Initial Stop Loss
TSL - Trailing Stop Loss
A. This is a high risk long entry as STS is OB on HTF. ISL is around 4830 just below the recent swing low. This trade got stopped out when trade B got triggered.
B. STS OB on HTF. Reversal short triggered on LTF when WMA crossed down below SMA. ISL was 4858 just above the short-term swing high above the moving averages. This trade got stopped out when trade C was triggered.
C. STS OS on HTF. Reversal long triggred when WMA crossed above SMA. ISL was around 4830 just below the recent short-term swing low. ISL moved up (TSL 1) when the swing high at 11:15 was broken at 11:40. This trade got stopped out when TSL was hit at point D.
D. TSL hit for trade C.
E. STS OS on HTF. Long reversal triggered when WMA crossed above SMA on LTF. This long reversal entry came in late due to the powerful reversal. SL was also quite far...so I am not sure how many would have taken this trade. But this trade was good (looking at it with hindsight). ISL was around 4815 below the swing low.
F. Looking at this point it is clear that it is a possible reversal to downside as STS is OB on HTF. The important point to note is that when in a profitable trade do not take the standard reversal signal, take the reversal only on break of a swing low (in case of long & swing high in case of shorts). If the trade is not profitable just go ahead and take the standard reversal signal when WMA crosses SMA. The reason for this is clear - price will have to prove itself. If it is a profitable trade, let it run because the probability is for the trend to go on. Let the price do a bit more and prove itself for us to take a reversal. If the trade is not profitable then price has already proven itself indicating that we are wrong so go ahead and take the reversal as price is indicating that it is already going in the other direction.
Three whipsaws and one good trade....I have seen worse days than this for this system....check 3rd & 10th Aug as examples. Most other days have been very decent. Most months have 3-4 such days for this system, the important thing is to handle the trade well on these days.
| Description: |
|
| Filesize: |
224.06 KB |
| Viewed: |
470 Time(s) |
|
_________________
Srikanth Kurdukar
@SwingTrader |
|
| Back to top |
|
|
manass
White Belt
Joined: 21 Sep 2009
Posts: 172
|
| Post: #54 Posted: Mon Aug 22, 2011 11:43 pm Post subject: Re: MTT - NF - 22.08.2011 |
|
|
Thanks SwingTrader for a beautiful explanation
Regards
|
|
| Back to top |
|
|
SwingTrader
Site Admin
Joined: 11 Aug 2006
Posts: 2903
Location: Hyderabad, India
|
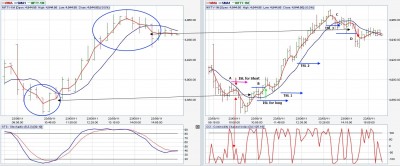
| Post: #55 Posted: Tue Aug 23, 2011 7:16 pm Post subject: |
|
|
NF MTT chart for 23.08.2011
A. NF was in short-term downtrend after open on HTF, a standard short was triggered by CCI at 10:05 (marked on 10:10 bar on the chart as that is when the entry would have been made). This was a high risk trade as STS on HTF was OS. ISL for the trade was around 4898 (2 pts above recent swing high). This trade was stopped out (before ISL was hit) when reversal long was triggered at point B.
B. When trade A was active STS on HTF went OS which suggested possible reversal long soon. But since a short was active, as I said yesterday, price would have to prove itself for us to reverse the position by closing above a swing high that was above both moving averages (on LTF). This happened on the 11:10 bar (the position was reversed on the next bar - short closed, long initiated). ISL was around 4879 (just below recent swing low). TSLs for the trade are marked on the chart (just below higher swing lows).
C. When trade B was active STS on HTF went OB which suggested possible reversal short soon. But since a long was active price would have to close below a swing low that was below the moving averages on LTF. Before that TSL for the long was hit. A short could have been initiated after that itself by reversing the position or optionally after a swing low was broken (as indicated on the chart). This trade would have had to be closed just before market close.
| Description: |
|
| Filesize: |
238.62 KB |
| Viewed: |
477 Time(s) |
|
_________________
Srikanth Kurdukar
@SwingTrader |
|
| Back to top |
|
|
vinay28
Black Belt

Joined: 24 Dec 2010
Posts: 11748
|
| Post: #56 Posted: Tue Aug 23, 2011 8:01 pm Post subject: |
|
|
Lovely ST, thanks. Did enter my head a bit. Would it possible for you to post such commentries intraday for immediate understanding please, like you do under a different thread; "analysing NF using icharts...."?
Vinay
|
|
| Back to top |
|
|
jjm
White Belt
Joined: 17 Mar 2010
Posts: 411
|
| Post: #57 Posted: Tue Aug 23, 2011 8:06 pm Post subject: |
|
|
| SwingTrader wrote: | NF MTT chart for 23.08.2011
A. NF was in short-term downtrend after open on HTF, a standard short was triggered by CCI at 10:05 (marked on 10:10 bar on the chart as that is when the entry would have been made). This was a high risk trade as STS on HTF was OS. ISL for the trade was around 4898 (2 pts above recent swing high). This trade was stopped out (before ISL was hit) when reversal long was triggered at point B.
B. When trade A was active STS on HTF went OS which suggested possible reversal long soon. But since a short was active, as I said yesterday, price would have to prove itself for us to reverse the position by closing above a swing high that was above both moving averages (on LTF). This happened on the 11:10 bar (the position was reversed on the next bar - short closed, long initiated). ISL was around 4879 (just below recent swing low). TSLs for the trade are marked on the chart (just below higher swing lows).
C. When trade B was active STS on HTF went OB which suggested possible reversal short soon. But since a long was active price would have to close below a swing low that was below the moving averages on LTF. Before that TSL for the long was hit. A short could have been initiated after that itself by reversing the position or optionally after a swing low was broken (as indicated on the chart). This trade would have had to be closed just before market close. |
Dear Stji
I took all these trades..Had a plan of posting same..but as true master you have already posted it...
Glad to inform; after almost one and half years in stock market and tried various strategies for intra trade... I am completely Convinced with strategy...and started trading based on it..
Fist short @ 4891 stopped out at 4887 = +4 pts,,
2nd long @ 4898 closed at 4960 = + 62 pts
3rd short @ 4961 closed at 4945 = + 16 pts
Total gain : 82 pts
The way it is explained ...

Regards,
JJM
|
|
| Back to top |
|
|
SwingTrader
Site Admin
Joined: 11 Aug 2006
Posts: 2903
Location: Hyderabad, India
|
| Post: #58 Posted: Tue Aug 23, 2011 8:50 pm Post subject: |
|
|
| vinay28 wrote: | Lovely ST, thanks. Did enter my head a bit. Would it possible for you to post such commentries intraday for immediate understanding please, like you do under a different thread; "analysing NF using icharts...."?
Vinay |
Vinay,
I will try my best to do it...I may not be able to post every trade/idea of interest due to the other work I am busy with during the market hours but I will surely try.
_________________
Srikanth Kurdukar
@SwingTrader |
|
| Back to top |
|
|
SwingTrader
Site Admin
Joined: 11 Aug 2006
Posts: 2903
Location: Hyderabad, India
|
| Post: #59 Posted: Tue Aug 23, 2011 8:55 pm Post subject: |
|
|
| jjm wrote: |
Dear Stji
I took all these trades..Had a plan of posting same..but as true master you have already posted it...
Glad to inform; after almost one and half years in stock market and tried various strategies for intra trade... I am completely Convinced with strategy...and started trading based on it..
Fist short @ 4891 stopped out at 4887 = +4 pts,,
2nd long @ 4898 closed at 4960 = + 62 pts
3rd short @ 4961 closed at 4945 = + 16 pts
Total gain : 82 pts
The way it is explained ...
Regards,
JJM |
Very happy to hear this.
Good luck to you.
_________________
Srikanth Kurdukar
@SwingTrader |
|
| Back to top |
|
|
jjm
White Belt
Joined: 17 Mar 2010
Posts: 411
|
| Post: #60 Posted: Wed Aug 24, 2011 9:59 am Post subject: |
|
|
Dear stji,
Today in LTf we have got + cross over of moving averages but candle is yet to close above recent swing high...
In this case the recent swing high is 4970 ..Trust my understanding is correct..
FOr regular trade
The conditions to be fulfilled
HTF wma above sma:which is in currently candle, however candle yet to close..
LTF : 2nd condition pls clarify swing high is 4970 or 4952
STS is in neutral zone
Regards,
JJM
|
|
| Back to top |
|
|
|


