| View previous topic :: View next topic |
| Author |
M&M .. Is it H&S? |
ronypan
White Belt

Joined: 07 Aug 2010
Posts: 197
|
Post: #1  Posted: Sun May 15, 2011 12:29 pm Post subject: M&M .. Is it H&S? Posted: Sun May 15, 2011 12:29 pm Post subject: M&M .. Is it H&S? |
 |
|
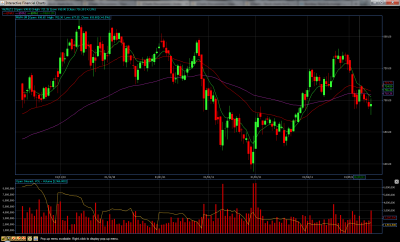
M&M .. Is it H&S?
| Description: |
|
| Filesize: |
146.14 KB |
| Viewed: |
623 Time(s) |
|
|
|
| Back to top |
|
 |
|
|
|
ronypan
White Belt
Joined: 07 Aug 2010
Posts: 197
|
| Post: #2 Posted: Sun May 15, 2011 12:41 pm Post subject: Herohonda |
|
|
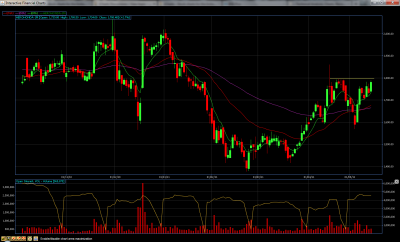
Herohonda Fut... Can we consider breakout above 1795? For the tgt of 1980.
Experts plz comments..
| Description: |
|
| Filesize: |
142.44 KB |
| Viewed: |
586 Time(s) |
|
|
|
| Back to top |
|
|
casper
Green Belt

Joined: 02 Oct 2010
Posts: 1315
|
| Post: #3 Posted: Sun May 15, 2011 7:52 pm Post subject: |
|
|
hi rony
yes m&m is a h/s and being slopped down its more bearish than a normal h/s, neck line is around 678,however the range between 669-662 is going to be a tough range below which we can expect further fall
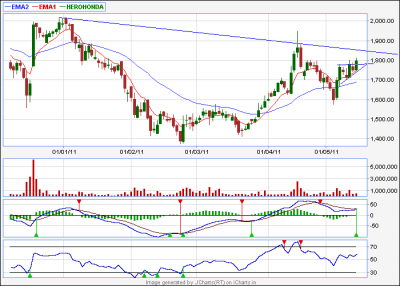
herohonda is an at, but will it work in this 3rd class, hopeless market? i doubt! by the way, i can see a downward slopping trend line at 1850 range, even if it zooms and u buy, be careful at 1850, above which (if it were a normal market) 1900 and 1933 is the likely targets here (1900 is monthly level and 1933 is another trend line we can get by adding the previous tops)
ps- as per cash chart it has already broken out but widout much volume, so ita a caution case too
| Description: |
|
| Filesize: |
13.74 KB |
| Viewed: |
560 Time(s) |
|
|
|
| Back to top |
|
|
S.S.
White Belt
Joined: 09 Feb 2011
Posts: 241
|
| Post: #4 Posted: Sun May 15, 2011 9:54 pm Post subject: |
|
|
hi rony
how u doing ???
dada i want to add one more range for m&m 641/645 and 662 monthly s2 so this two support range and rsi has 39 as support
n abt honda i thing auto stock slapped twice first by intrest rate hike and now petrol price hike so i m also having doubt and 1830 is also watchful
correct me if i m wrong......
|
|
| Back to top |
|
|
grizzlybull
White Belt
Joined: 26 Sep 2010
Posts: 80
|
| Post: #5 Posted: Sun May 15, 2011 10:21 pm Post subject: |
|
|
| S.S. wrote: | hi rony
how u doing ???
dada i want to add one more range for m&m 641/645 and 662 monthly s2 so this two support range and rsi has 39 as support
n abt honda i thing auto stock slapped twice first by intrest rate hike and now petrol price hike so i m also having doubt and 1830 is also watchful
correct me if i m wrong...... |
when using technical analysis why bother about fundamentals? that's a way by which many technicians fail, they peek into the fundamentals.
|
|
| Back to top |
|
|
grizzlybull
White Belt
Joined: 26 Sep 2010
Posts: 80
|
| Post: #6 Posted: Sun May 15, 2011 10:37 pm Post subject: Re: M&M .. Is it H&S? |
|
|
| ronypan wrote: | | M&M .. Is it H&S? |
it was a medium term H&S , just as sensex had a (medium term ascending triangle), then when it fell at 788 levels, it has been in a potential long term downtrend and if it finds support at 600, it will be making a major top or a consolidation, whichever the case may be.
my opinion.
grizzly
|
|
| Back to top |
|
|
casper
Green Belt
Joined: 02 Oct 2010
Posts: 1315
|
| Post: #7 Posted: Sun May 15, 2011 10:48 pm Post subject: |
|
|
| grizzlybull wrote: | | S.S. wrote: | hi rony
how u doing ???
dada i want to add one more range for m&m 641/645 and 662 monthly s2 so this two support range and rsi has 39 as support
n abt honda i thing auto stock slapped twice first by intrest rate hike and now petrol price hike so i m also having doubt and 1830 is also watchful
correct me if i m wrong...... |
when using technical analysis why bother about fundamentals? that's a way by which many technicians fail, they peek into the fundamentals. |
r they two very diff ways to analyse things? by da way, the points me or s.s. mentioned are not just"fundamental analysis" in true sense, its called "sentimental analysis"
the following is link from PT sir's favorite babypips.com
http://www.babypips.com/school/sentimental-analysis.html
plz go through it to find out more
by da way
in my lil bit exp in market, i hv seen so many bearish set ups giving break outs with a positive news and many more bullish set ups giving break down with a negative news flow, so in my humble view, one should watch out before betting, every market condition is not suitable for every kind of trades

|
|
| Back to top |
|
|
grizzlybull
White Belt
Joined: 26 Sep 2010
Posts: 80
|
| Post: #8 Posted: Sun May 15, 2011 10:57 pm Post subject: |
|
|
| casper wrote: | | grizzlybull wrote: | | S.S. wrote: | hi rony
how u doing ???
dada i want to add one more range for m&m 641/645 and 662 monthly s2 so this two support range and rsi has 39 as support
n abt honda i thing auto stock slapped twice first by intrest rate hike and now petrol price hike so i m also having doubt and 1830 is also watchful
correct me if i m wrong...... |
when using technical analysis why bother about fundamentals? that's a way by which many technicians fail, they peek into the fundamentals. |
r they two very diff ways to analyse things? by da way, the points me or s.s. mentioned are not just"fundamental analysis" in true sense, its called "sentimental analysis"
the following is link from PT sir's favorite babypips.com
http://www.babypips.com/school/sentimental-analysis.html
plz go through it to find out more
by da way
in my lil bit exp in market, i hv seen so many bearish set ups giving break outs with a positive news and many more bullish set ups giving break down with a negative news flow, so in my humble view, one should watch out before betting, every market condition is not suitable for every kind of trades
|
set ups stopped working ever since technical knowledge became widespread, stock operators create those set ups, it is a new and cheap game played by them. The sentiment can be seen on the breakout, buying and selling on news is an unsystematic way to trade.
|
|
| Back to top |
|
|
S.S.
White Belt
Joined: 09 Feb 2011
Posts: 241
|
| Post: #9 Posted: Mon May 16, 2011 12:59 am Post subject: |
|
|
| grizzlybull wrote: |
when using technical analysis why bother about fundamentals? that's a way by which many technicians fail, they peek into the fundamentals. |
this is not a fundamental analysis my brother. the reason behind the post is such present scenario may not help the break out to go further some time good news in bad market or bad news in good market become impetus force to reverse the market and some times they soak up. Current market is not in Bull Run so it is very much possible such –ve news or – action impact more.
and i m not at all denying that its not a break out but I belive we should not take any position where we r not comfortable abt the target n i m not in fvr of buying honda at this moment. i might be wrong but the way last week was passed out I believe market has to react on that whether I m wrong or right …..well. . . let the time will tell…..n i m sure i could learn something out of it.but on Monday opening i like to watch how market respond the petrol hike n if it absorb the news I will find some strong bullish breakout and bet on it rather then putting my money on Lame horse. That’s it. 
|
|
| Back to top |
|
|
S.S.
White Belt
Joined: 09 Feb 2011
Posts: 241
|
| Post: #10 Posted: Mon May 16, 2011 1:06 am Post subject: |
|
|
| grizzlybull wrote: |
set ups stopped working ever since technical knowledge became widespread, stock operators create those set ups, it is a new and cheap game played by them. The sentiment can be seen on the breakout, buying and selling on news is an unsystematic way to trade. |
i m not 100% agree with u on this point. some stocks creat such senario but they r maily from btoz group n here is the imp of volume comes... stong bo/bd with strong volume works. n it dont they our analysis was wrong.
|
|
| Back to top |
|
|
ronypan
White Belt
Joined: 07 Aug 2010
Posts: 197
|
| Post: #11 Posted: Mon May 16, 2011 8:36 am Post subject: |
|
|
| casper wrote: | hi rony
yes m&m is a h/s and being slopped down its more bearish than a normal h/s, neck line is around 678,however the range between 669-662 is going to be a tough range below which we can expect further fall
herohonda is an at, but will it work in this 3rd class, hopeless market? i doubt! by the way, i can see a downward slopping trend line at 1850 range, even if it zooms and u buy, be careful at 1850, above which (if it were a normal market) 1900 and 1933 is the likely targets here (1900 is monthly level and 1933 is another trend line we can get by adding the previous tops)
ps- as per cash chart it has already broken out but widout much volume, so ita a caution case too |
Thank u very much casper, gizzlybull, s.s...
|
|
| Back to top |
|
|
S.S.
White Belt
Joined: 09 Feb 2011
Posts: 241
|
| Post: #12 Posted: Mon May 16, 2011 9:18 am Post subject: |
|
|
| thankx rony
|
|
| Back to top |
|
|
S.S.
White Belt
Joined: 09 Feb 2011
Posts: 241
|
| Post: #13 Posted: Mon May 16, 2011 3:22 pm Post subject: |
|
|
hero honda  
|
|
| Back to top |
|
|
grizzlybull
White Belt
Joined: 26 Sep 2010
Posts: 80
|
| Post: #14 Posted: Mon May 16, 2011 3:48 pm Post subject: |
|
|
| S.S. wrote: | | grizzlybull wrote: |
when using technical analysis why bother about fundamentals? that's a way by which many technicians fail, they peek into the fundamentals. |
this is not a fundamental analysis my brother. the reason behind the post is such present scenario may not help the break out to go further some time good news in bad market or bad news in good market become impetus force to reverse the market and some times they soak up. Current market is not in Bull Run so it is very much possible such –ve news or – action impact more.
and i m not at all denying that its not a break out but I belive we should not take any position where we r not comfortable abt the target n i m not in fvr of buying honda at this moment. i might be wrong but the way last week was passed out I believe market has to react on that whether I m wrong or right …..well. . . let the time will tell…..n i m sure i could learn something out of it.but on Monday opening i like to watch how market respond the petrol hike n if it absorb the news I will find some strong bullish breakout and bet on it rather then putting my money on Lame horse. That’s it. |
sure, general sentiment might also have a role. Yeah you're right, this isn't fundamental analysis either. actually I like to find out the sentiment via volumes, ie, how strong is the selling pressure, buying pressure etc...
|
|
| Back to top |
|
|
|


