|
|
| View previous topic :: View next topic |
| Author |
MY CHART (AND YOUR TOO.............) |
hasten
White Belt

Joined: 30 Jun 2011
Posts: 216
|
Post: #106  Posted: Tue Jan 17, 2012 9:13 pm Post subject: On the verge of completing a 4 yr long 'Triangle Patt'! Posted: Tue Jan 17, 2012 9:13 pm Post subject: On the verge of completing a 4 yr long 'Triangle Patt'! |
 |
|
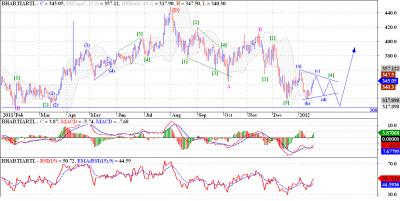
This is a daily chart of Bharti. I have marked wave {D} in the middle top portion of the chart. This {D} is actually second last wave of a triangle. This triangle has been forming since 2007, so one can say that Bharti was in consolidation since approximately 4 years. Now wave {E} must be a 3 wave structure, and we can see that we have already completed waves A and B, now forming wave C of {E} of (IV). We might form a triangle in wave [4] of C of {E}. Once this wave [4] and [5] are done we will get a sharp thrust which will be coming out of a 4 year long triangle. So it will be worth waiting for.
Regards, hasten
Technical analysis is a skill that improves with experience and study. Always be a student and keep learning.
| Description: |
|
| Filesize: |
64.24 KB |
| Viewed: |
593 Time(s) |
|
|
|
| Back to top |
|
 |
|
| |
hasten
White Belt
Joined: 30 Jun 2011
Posts: 216
|
| Post: #107 Posted: Tue Jan 17, 2012 9:48 pm Post subject: NIFTY |
|
|
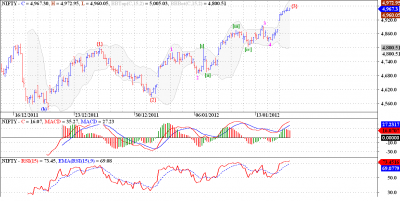
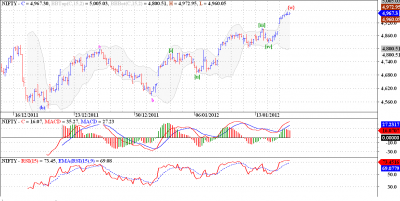
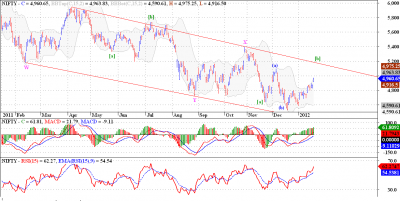
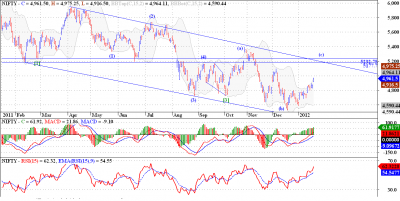
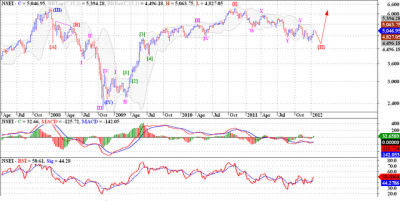
I have also included 'hourly count' for nifty along with weekly and daily counts. And according to the hourly count on Nifty we can spot two possibilities.
One of the possibilities is that of an irregular flat correction in wave [b] of wave Z of the TZZ. In that case Nifty should atleast test the high of wave (a) around 5100 levels. Then it should come down sharply in wave [c] of Z.
Second count suggests that we are forming a triangle in wave [4] of wave I down. Now the if this works out then we may see Nifty rallying above the 5100 levels towards the 4175 mark, all we want in this count is that wave (e) of [4] should not go above the levels of 5175, which is the low of wave [1], as per the rules of impulse waves in EWP. This formation will take some time to develop, but with the ending diagonal scenario not remaining feasible, the next best count is that of a triangle n wave [4].
Regards, hasten
Always follow trading plan to get profit in the long run.
| Description: |
|
| Filesize: |
52.81 KB |
| Viewed: |
589 Time(s) |
|
| Description: |
|
| Filesize: |
51.96 KB |
| Viewed: |
513 Time(s) |
|
| Description: |
|
| Filesize: |
62.41 KB |
| Viewed: |
545 Time(s) |
|
| Description: |
|
| Filesize: |
62.74 KB |
| Viewed: |
587 Time(s) |
|
| Description: |
|
| Filesize: |
455.43 KB |
| Viewed: |
542 Time(s) |
|
| Description: |
|
| Filesize: |
60.69 KB |
| Viewed: |
537 Time(s) |
|
|
|
| Back to top |
|
|
rk_a2003
Black Belt

Joined: 21 Jan 2010
Posts: 2734
|
| Post: #108 Posted: Tue Jan 17, 2012 10:21 pm Post subject: Re: Infosys |
|
|
| hasten wrote: | Infy posted bad results and corrected sharply as a reaction to the news. But can this be a classic opportunity to accumulate Infy for a rally close to all time highs if not above them. Well if EWP patterns are to be believed then we have a glimmer of hope that we might see the stalwart of D street back to its full glory, before the gory bear market takes its tall on it.
What I see on the charts is that from Jan - Aug 2011 we saw a 3 wave fall in wave (A) of an irregular flat correction. Then we have rallied 3 months close to 2970 levels. From this level we have completed a flat correction where wave C was effected by the bad guidance Infy posted for 2012. But looking at the chart we don't see how 2012 can be bad for Infy, if the recent lows around 2555 is protected then we may see a rally moving sharply up when markets are positive but with shallow corrections when the market is not doing too well. Is this really possible, well if we really believe what we see, then it is. But Bolton found it difficult to believe what he saw, then we cannot pressure ourselves too much, can we?
Regards, hasten
Price is the ultimate indicator. Everything else is secondary. |
Hasten... A correction ---Infy results were good…. Its guidance is disappointing. This was taken by Market in a negative way.
|
|
| Back to top |
|
|
hasten
White Belt
Joined: 30 Jun 2011
Posts: 216
|
| Post: #109 Posted: Wed Jan 18, 2012 10:55 pm Post subject: USD CHF, big 5 wave move down seems to completed! |
|
|
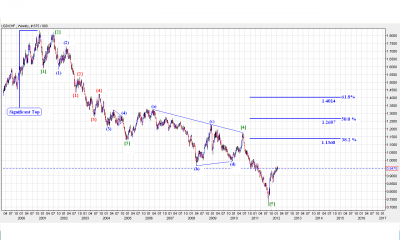
This is a weekly chart of USDCHF. And as we can see on the chart we have completed 5 wave down, the 5th wave ended with a spike down, which is a sign of prices rejecting such levels. As per EWP a 5 wave move is followed by a 3 wave retracement, so we might see the recent rise in prices extending towards the 3 fibo levels marked on the chart. The pattern which the corrective rally will form cannot be foretasted at this point in time, but we can safely say that we are bound to see higher levels on this pair.
Regards, hasten
trading is easy, you don’t need nuthin fancy just buy when it’s going up and sell when it’s going down, that’s all there is to it.
| Description: |
|
| Filesize: |
62.35 KB |
| Viewed: |
523 Time(s) |
|
|
|
| Back to top |
|
|
chaaru
White Belt
Joined: 16 Jun 2008
Posts: 3
|
| Post: #110 Posted: Thu Jan 19, 2012 9:17 am Post subject: Bharti chart |
|
|
Hi Hasten,
Ref. the Bharti chart poeted on 17th Jan. Look at the downwave following {D}. Isn't the Subwave [3] of A shorter than subwave [1]? Is that allowed in EW?
|
|
| Back to top |
|
|
hasten
White Belt
Joined: 30 Jun 2011
Posts: 216
|
| Post: #111 Posted: Thu Jan 19, 2012 1:00 pm Post subject: Re: Bharti chart |
|
|
| chaaru wrote: | Hi Hasten,
Ref. the Bharti chart poeted on 17th Jan. Look at the downwave following {D}. Isn't the Subwave [3] of A shorter than subwave [1]? Is that allowed in EW? |
wave [3] is shorter than [1] but as per EWP wave [3] cannot be the shortest, so here wave [5] is shorter than wave [3] and that's why this count is as per the EWP rules and guidelines.
Regards, hasten
You cannot change the direction of the wind,but you CAN adjust your sail...
|
|
| Back to top |
|
|
ktpillai
White Belt
Joined: 23 Nov 2007
Posts: 95
|
| Post: #112 Posted: Thu Jan 19, 2012 3:48 pm Post subject: Re: Bharti chart |
|
|
| hasten wrote: | | chaaru wrote: | Hi Hasten,
Ref. the Bharti chart poeted on 17th Jan. Look at the downwave following {D}. Isn't the Subwave [3] of A shorter than subwave [1]? Is that allowed in EW? |
wave [3] is shorter than [1] but as per EWP wave [3] cannot be the shortest, so here wave [5] is shorter than wave [3] and that's why this count is as per the EWP rules and guidelines.
Regards, hasten
Wave [1] must be extended which makes wave[3] looks shorter than wave[1] and Wave [5] shorter than Wave[3] and it is as per the rules of the game
You cannot change the direction of the wind,but you CAN adjust your sail... |
|
|
| Back to top |
|
|
hasten
White Belt
Joined: 30 Jun 2011
Posts: 216
|
| Post: #113 Posted: Thu Jan 19, 2012 10:33 pm Post subject: Re: Bharti chart |
|
|
| ktpillai wrote: | | hasten wrote: | | chaaru wrote: | Hi Hasten,
Ref. the Bharti chart poeted on 17th Jan. Look at the downwave following {D}. Isn't the Subwave [3] of A shorter than subwave [1]? Is that allowed in EW? |
wave [3] is shorter than [1] but as per EWP wave [3] cannot be the shortest, so here wave [5] is shorter than wave [3] and that's why this count is as per the EWP rules and guidelines.
Regards, hasten
Wave [1] must be extended which makes wave[3] looks shorter than wave[1] and Wave [5] shorter than Wave[3] and it is as per the rules of the game
You cannot change the direction of the wind,but you CAN adjust your sail... |
|
Point 1. 354.80 is clear visual pivot (where i am considering wave I) .
Point 2. It comes after 61.8% of fibonacci retracement .
Point 3. after ended of wave {I} bharti gave more then 20 % retracement of correction rally (412-355) that was the confirmation of wave {1}.( means count is perfect)
Point 4. In this particular case we are considering a leading diagonal pattern.
Regards, hasten
If Your Trading Performance is Good, it's Only Because You Haven't Yet Made it Better!
|
|
| Back to top |
|
|
hasten
White Belt
Joined: 30 Jun 2011
Posts: 216
|
| Post: #114 Posted: Fri Jan 20, 2012 10:47 pm Post subject: Banknifty 5 wave move nearing completion! |
|
|
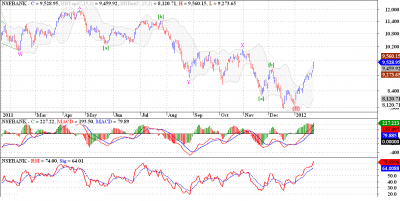
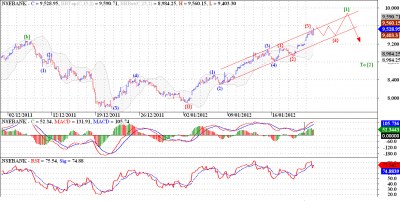
This daily chart of Banknifty shows unlike Nifty Banknifty has completed the TZZ correction. Now it is ready to start a big up move, and the recent price action supports our view.
But according to EWP once a 5 wave up move is complete we get a corection to that upmove. And this stupendous rise in Banknifty is very close to completing the 5 wave advance, check the hourly chart below.
In this chart we can see that currently we are forming an extension in wave (5) of this 5 wave upmove. And once complete should be subjected to a sharp correction owing to the extension in the wave (5). The (a) wave of this correction will reach the low of wave {2} of the extending wave (5). And then after a corrective advance wave (c) should resume. Since we expect Nifty to make a new low, this correction should be deep in case of Banknifty. Lets see how things pan out in near future, but Banknifty bulls beware.
Regards, hasten
When in doubt,get out and don't get in when in doubt .
| Description: |
|
| Filesize: |
59.29 KB |
| Viewed: |
491 Time(s) |
|
| Description: |
|
| Filesize: |
58.04 KB |
| Viewed: |
499 Time(s) |
|
|
|
| Back to top |
|
|
hasten
White Belt
Joined: 30 Jun 2011
Posts: 216
|
| Post: #115 Posted: Fri Jan 20, 2012 10:54 pm Post subject: Nifty in persistent up trend, trying a new count this time! |
|
|
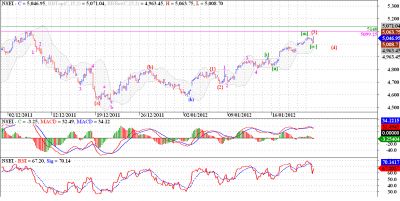
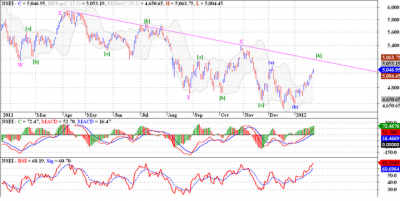
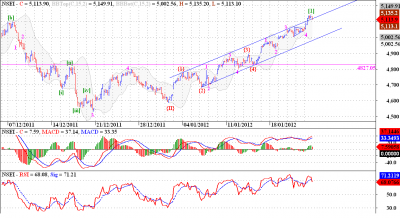
I am trying a different count today. Please read this hourly chart in conjunction with the weekly and daily charts which have been updated today.
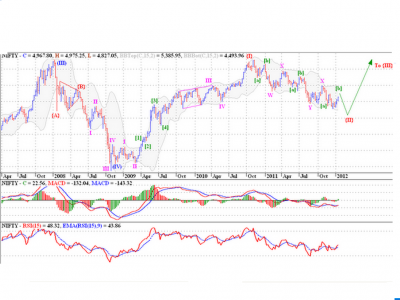
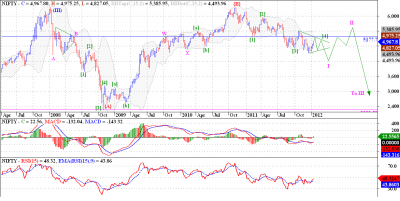
Nifty may have formed a failed {c} wave in (b). And the rise towards the 5100 levels is the (c) wave of an irregular flat correction in wave [b] of the third leg of the TZZ. Wave {2} of (c) of [b] was a sharp correction so expect wave {4} to be a sideways consolidation, a triangle or a flat, possibly. Look for the MACD to come down towards 0 level on wave {4}, and a final dash to the 5100 - 40 levels to conclude wave {5}and this up move. Only time will tell.
Regards, hasten
Making money in trading is not the hard part, KEEPING it is !
| Description: |
|
| Filesize: |
57.36 KB |
| Viewed: |
566 Time(s) |
|
| Description: |
|
| Filesize: |
161.31 KB |
| Viewed: |
572 Time(s) |
|
| Description: |
|
| Filesize: |
151.81 KB |
| Viewed: |
520 Time(s) |
|
|
|
| Back to top |
|
|
pkholla
Black Belt
Joined: 04 Nov 2010
Posts: 2890
|
| Post: #116 Posted: Sat Jan 21, 2012 11:06 am Post subject: |
|
|
| hasten: please can you also post with candlesticks? The traditional American lines with hooks are very difficult to understand after someone has switched to candlestick graph warm regards prakash holla
|
|
| Back to top |
|
|
hasten
White Belt
Joined: 30 Jun 2011
Posts: 216
|
| Post: #117 Posted: Wed Jan 25, 2012 12:29 am Post subject: |
|
|
| pkholla wrote: | | hasten: please can you also post with candlesticks? The traditional American lines with hooks are very difficult to understand after someone has switched to candlestick graph warm regards prakash holla |
You can draw your own too in simple way just draw on bar chart and switch to candlestick chart (very simple ) .the problem is ,in my charting platform (which i am using for elliott wave analysis ) there is no option for candlestick chart ,but if you required any particular chart with candlestick ,i will draw for you .
Regards, hasten
The best traders have developed an edge and most importantly, they trust their edge.
Last edited by hasten on Wed Jan 25, 2012 1:04 am; edited 1 time in total |
|
| Back to top |
|
|
hasten
White Belt
Joined: 30 Jun 2011
Posts: 216
|
| Post: #118 Posted: Wed Jan 25, 2012 12:41 am Post subject: Nifty sported a 'throwover' but closed back in the channel ! |
|
|
Nifty broke above the upper channel line but around the close it came down and closed below the channel line, typical development for a 5th wave extension, called a 'Throw over'. Such a development suggests an end to the impulse wave under consideration, but will Nifty follow our analysis? That remains to be seen. But if we have completed this 5 wave move, with wave {5} extension then we can expect the correction to this move reach rapidly to the wave 2 of extended wave {5}, and further to the wave {4} of this impulse wave, the range comes around 4900 - 4800 levels. Let us now observe if we get the next 300 odd points to the down side, stop loss for any shorts should be above today's high. Below 4850 this view gets added confirmation.
Disclaimer :This is my personal opinion , this is not a solicitation to buy or sell. I do not accept responsibility for financial decisions taken by any forum member . The aim is to provide a reasonably accurate picture related to opportunities based on technical charts. Please be confident on yourself too before investing.
Regards, hasten
Good trading is not about being right,it is about trading right.If you want to be successful,you need to think of the long run and ignore the outcome of individual trades.....
| Description: |
| Nifty sported a 'throwover' but closed back in the channel ! |
|
| Filesize: |
56.37 KB |
| Viewed: |
581 Time(s) |
|
|
|
| Back to top |
|
|
vinay28
Black Belt
Joined: 24 Dec 2010
Posts: 11748
|
| Post: #119 Posted: Wed Jan 25, 2012 8:33 am Post subject: |
|
|
| hasten, your chart is NF or NS?
|
|
| Back to top |
|
|
hasten
White Belt
Joined: 30 Jun 2011
Posts: 216
|
| Post: #120 Posted: Wed Jan 25, 2012 9:16 am Post subject: |
|
|
| vinay28 wrote: | | hasten, your chart is NF or NS? |
Cash
Regards, hasten
Don’t let the outcome of one trade alter your trading discipline. One trade doesn’t make a system..
|
|
| Back to top |
|
|
|
|
You cannot post new topics in this forum
You cannot reply to topics in this forum
You cannot edit your posts in this forum
You cannot delete your posts in this forum
You cannot vote in polls in this forum
You can attach files in this forum
You can download files in this forum
|
Powered by phpBB © 2001, 2005 phpBB Group
|
|
|


