|
|
| View previous topic :: View next topic |
| Author |
MY CHART (AND YOUR TOO.............) |
hasten
White Belt

Joined: 30 Jun 2011
Posts: 216
|
Post: #121  Posted: Wed Jan 25, 2012 5:33 pm Post subject: Nifty third wave extension continues ! Posted: Wed Jan 25, 2012 5:33 pm Post subject: Nifty third wave extension continues ! |
 |
|
Nifty has eluded us since last couple of weeks, and thats probably because we are in a bull trend already. I have given up forcing market as per my count, and have tried to see what market is telling us, and the chart besides shows what I think market is telling us. We are extending in wave (3) of [3]. Once this wave (3) is done, we may see a brief correction to 5040, only to resume wave [5] up. The 261.8% projection of wave [1] comes around 5300 levels, i feel the probable target for this whole up move in wave I may reach this area around 5300. Kudos to those who were adamant bulling during this rally.
Regards, hasten
When in doubt,get out and don't get in when in doubt .
| Description: |
| Nifty third wave extension continues ! |
|
| Filesize: |
73.4 KB |
| Viewed: |
566 Time(s) |
|
|
|
| Back to top |
|
 |
|
| |
hasten
White Belt
Joined: 30 Jun 2011
Posts: 216
|
| Post: #122 Posted: Wed Jan 25, 2012 5:42 pm Post subject: Dollar index DZZ possibility ! |
|
|
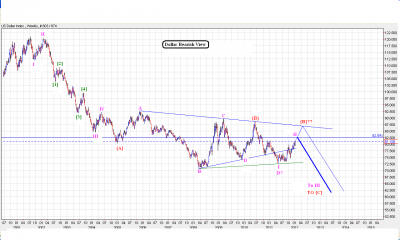
This is the chart which was posted on 9 Dec 2011, please refer the post here. We said there were two possibilities on DX one of an extended up move, and one that of a triangular consolidation. In the 'triangular consolidation' view, we had a possibility of wave E either completed or one more up leg possible to finish it. In today's post I am giving a chart which suggests a possible DZZ in wave E of {B} before an extensive down slide begins from here.
This adjacent chart shows that DZZ formation. We might correct right now till 78.25 - 77.40 levels, to complete wave (b) and then rise one more time to complete the wave [c] of this DZZ correction. What may happen only time will tell, but its always good to have a few road maps the prices may take in due course of time. Our other two vies of the post on 9-12-11 are still in play.
Regards, hasten
Every dream has a price
| Description: |
|
| Filesize: |
50.31 KB |
| Viewed: |
544 Time(s) |
|
| Description: |
|
| Filesize: |
43.31 KB |
| Viewed: |
508 Time(s) |
|
|
|
| Back to top |
|
|
pkholla
Black Belt

Joined: 04 Nov 2010
Posts: 2890
|
| Post: #123 Posted: Wed Jan 25, 2012 5:45 pm Post subject: |
|
|
Earlier reply from hasten: You can draw your own too in simple way just draw on bar chart and switch to candlestick chart (very simple ) .the problem is ,in my charting platform (which i am using for elliott wave analysis ) there is no option for candlestick chart ,but if you required any particular chart with candlestick ,i will draw for you . Regards, hasten
hasten: thank you for the reply and tip. will do as you suggest. no need for you to take trouble (esp after your clarification about charting software) regards prakash holla
|
|
| Back to top |
|
|
hasten
White Belt
Joined: 30 Jun 2011
Posts: 216
|
| Post: #124 Posted: Wed Jan 25, 2012 10:41 pm Post subject: Re: TATA MOTORS |
|
|
| hasten wrote: | Tata Motors is rising well after resolving a triangle in wave (4) as shown on the chart. Prices may be forming a big flat correction in TML. We completed the A wave, now rising in wave [a] of B. The target for this wave (5) of [a] should be between 208 - 225 range, preferably towards the higher boundary. After that we may come down in wave [b].
Regards, hasten
You know my method. It is founded upon the observation of trifles. It is, of course, a trifle, but there is nothing so important as trifles.
|
As shown in previous study chart after {E} lag we denoted target of 225 with projected golden line .As per calculation 225 also achieved ....now does it forming a Kilroy Pattern ??? answer is probably Yes .
Regards, hasten
I strive to put in perfect trades again and again, every time, always.
|
|
| Back to top |
|
|
DEVIKAUSR
White Belt
Joined: 08 Mar 2010
Posts: 92
|
| Post: #125 Posted: Thu Jan 26, 2012 9:18 am Post subject: TATAMOTOR CALL |
|
|
DEAR SIR
GM
I HAD SHORTED A CALL OF TATAMOTOR ie 245 CALL@5.30(FEB)
SHOULD I WAIT OR BOOK LOSS
PL ADVICE
REDARDS
KAUSHIK
|
|
| Back to top |
|
|
hasten
White Belt
Joined: 30 Jun 2011
Posts: 216
|
| Post: #126 Posted: Mon Jan 30, 2012 8:50 am Post subject: Re: TATAMOTOR CALL |
|
|
| DEVIKAUSR wrote: | DEAR SIR
GM
I HAD SHORTED A CALL OF TATAMOTOR ie 245 CALL@5.30(FEB)
SHOULD I WAIT OR BOOK LOSS
PL ADVICE
REDARDS
KAUSHIK |
Sorry option is beyond our topic ,no comments .
Regards,hasten
Price is the ultimate indicator. Everything else is secondary.
|
|
| Back to top |
|
|
hasten
White Belt
Joined: 30 Jun 2011
Posts: 216
|
| Post: #127 Posted: Mon Jan 30, 2012 9:27 am Post subject: An attempt at USDINR long term Elliott Wave analysis ! |
|
|
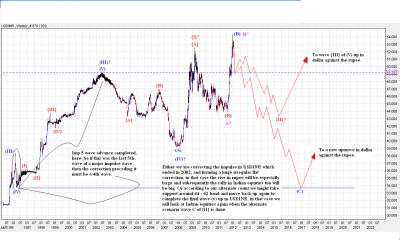
This is my attempt at long term analysis of USDINR.
Looking at the bullish picture that is emerging in Indian equities, I have labelled two scenarios one which is ultra bullish for INR and another where the rally in INR will be limited to 44 - 42 range.
Case I : USDINR completed an impulse in 2002, and since then we are forming a huge 'irregular flat' pattern, the waves (A) and (B) are done, and now we are embarking on wave (C) of that correction which should be especially severe on Dollar against the Rupee. Rupee will stage a big rally and may target the price area around 34 - 33 range. This may sound a bit audacious at this juncture but one must be mindful of the fact that Elliott waves are fractal in nature, and play out in the same manner no mater what the time frame under consideration.
Case II : This alternate scenario is marked with wave labels followed by a question mark, but I am not sure of the probabilities associated with these count, so at this stage I am considering both of them equiprobable. Now as per our alternate count, what ended in 2002 was actually the wave (III) of this big rally in USDINR, and we completed wave (IV) in 2008, what occurred during 2008 - 2009 was wave {I} of the wave (V) of this big impulse wave. Following wave {I} we formed waves A and C of an irregular flat correction, and are now falling in wave C of {II} and should find support around 44 - 42 levels. This scenario may not be as bad for USDINR as case I.
Obviously Case I is very bullish for Indian equities, whereas Case II is bullish in the short term but will prove bearish in the medium to long term. I would like to draw your attention to a recent development, where India and Iran have entered into a pact, according to it Indian will buy Crude-oil from Iran but will pay them in GOLD not Dollars. Can this be the start of major economies fueled by domestic demand and not credit expansion, rejecting the Greenback as the globally accepted medium of exchange. As always only time will tell.
Regards, hasten
Someone is sitting in the shade today because someone planted a tree a long time ago.
| Description: |
|
| Filesize: |
83.64 KB |
| Viewed: |
565 Time(s) |
|
|
|
| Back to top |
|
|
vinay28
Black Belt
Joined: 24 Dec 2010
Posts: 11748
|
| Post: #128 Posted: Mon Jan 30, 2012 10:02 am Post subject: |
|
|
| 34 a dollar by 2017 looks more plausible
|
|
| Back to top |
|
|
hasten
White Belt
Joined: 30 Jun 2011
Posts: 216
|
| Post: #129 Posted: Mon Jan 30, 2012 4:16 pm Post subject: NIFTY weekly count update |
|
|
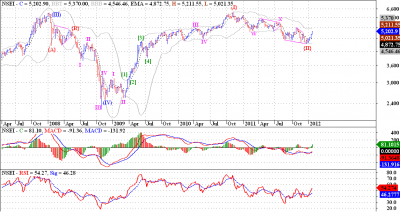
Nifty weekly count update
Regards, hasten
I strive to put in perfect trades again and again, every time, always.
| Description: |
|
| Filesize: |
55.74 KB |
| Viewed: |
521 Time(s) |
|
|
|
| Back to top |
|
|
hasten
White Belt
Joined: 30 Jun 2011
Posts: 216
|
| Post: #130 Posted: Mon Jan 30, 2012 4:19 pm Post subject: Nifty daily count update |
|
|
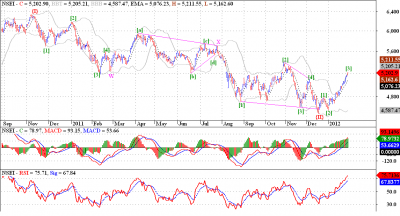
Nifty daily count update
Regards,hasten
Trading is easy, you don’t need nuthin fancy just buy when it’s going up and sell when it’s going down, that’s all there is to it.
| Description: |
|
| Filesize: |
62.88 KB |
| Viewed: |
529 Time(s) |
|
|
|
| Back to top |
|
|
hasten
White Belt
Joined: 30 Jun 2011
Posts: 216
|
| Post: #131 Posted: Mon Jan 30, 2012 4:22 pm Post subject: Nifty wave [4] underway ! |
|
|
Nifty turned down today, and as mentioned earlier we are forming wave [4] of this impulse move, in wave I. So I am looking for support around 5040 - 5000 levels. The corrective pattern at this stage looks like a zigzag, but this being a wave [4] we cannot be too sure, first three wave move may give rise to a flat or a triangle. The upside target for this wave I is around 5400 levels, so there is some more upside left still. Look for reversal signals in 5040 - 5000 band.
(Kindly refer my daily and weekly count to get my count on the bigger picture.)
Disclaimer :This is my personal opinion , this is not a solicitation to buy or sell. I do not accept responsibility for financial decisions taken by any forum member . The aim is to provide a reasonably accurate picture related to opportunities based on technical charts. Please be confident on yourself too before investing.
Regards, hasten
Always follow trading plan to get profit in the long run.
| Description: |
|
| Filesize: |
55.76 KB |
| Viewed: |
578 Time(s) |
|
|
|
| Back to top |
|
|
hasten
White Belt
Joined: 30 Jun 2011
Posts: 216
|
| Post: #132 Posted: Thu Feb 02, 2012 2:24 am Post subject: Nifty rising in acceleration channel, wave [3] not yet done! |
|
|
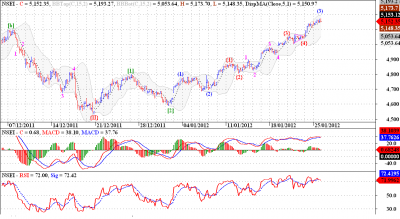
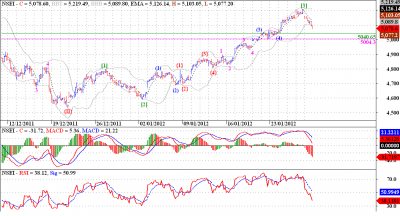
Nifty may not have finished wave [3] as of yet, we may be in wave (5) instead of [5], so there is some upside left still in this move and it looks like we may be headed for 5400 for sure. Look for wave (5) targets around 5300 5350 levels. Prices are rising in the acceleration channel still, we must break it to form wave [4]. Also spot the ZLR formation on MACD on wave (4), and RSI snapping back from OS levels. Prices may target upper channel boundary for wave (5).
Regards, hasten
Trend is your friend unless it is about to end!
| Description: |
|
| Filesize: |
57.13 KB |
| Viewed: |
567 Time(s) |
|
|
|
| Back to top |
|
|
hasten
White Belt
Joined: 30 Jun 2011
Posts: 216
|
| Post: #133 Posted: Thu Feb 02, 2012 4:33 pm Post subject: Facing resistance aroung 5300, once taken out stop is 5400 ! |
|
|
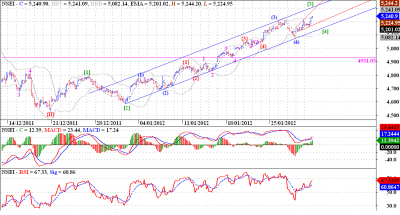
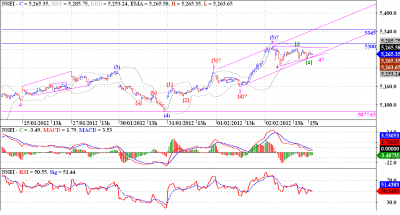
Nifty is sporting 3 different possibilities, two bullish, one bearish. Lets discuss them one by one.
A. Bullish case 1, we might be extending in wave wave 5 of {3}, and we get target for wave {3} around 5400 levels.
B. Bullish case 2, wave 4 of {3} may be forming a triangle and target for wave {3} may be around 5350.
C. Bearish case 3, a low probability expanding diagonal may have completed at (5) as shown in the chart and we will have to tank below the wave {4}at 5159.20 to confirm the count.
I am looking for an extension of wave 5 of {3} or a triangle in wave 4 of {3}, and according to the two preferred cases we might get some more upside may be around 5350 - 5400 levels.
Disclaimer :This is my personal opinion , this is not a solicitation to buy or sell. I do not accept responsibility for financial decisions taken by any forum member . The aim is to provide a reasonably accurate picture related to opportunities based on technical charts. Please be confident on yourself too before investing.
Regards, hasten
Efforts r never waste even when it leads to disappointing results, because it always makes u more prepared , stronger,capable and experienced.
| Description: |
|
| Filesize: |
52.17 KB |
| Viewed: |
575 Time(s) |
|
Last edited by hasten on Thu Feb 02, 2012 11:28 pm; edited 1 time in total |
|
| Back to top |
|
|
hasten
White Belt
Joined: 30 Jun 2011
Posts: 216
|
| Post: #134 Posted: Thu Feb 02, 2012 11:14 pm Post subject: Re: On the verge of completing a 4 yr long 'Triangle Patt'! |
|
|
| hasten wrote: | This is a daily chart of Bharti. I have marked wave {D} in the middle top portion of the chart. This {D} is actually second last wave of a triangle. This triangle has been forming since 2007, so one can say that Bharti was in consolidation since approximately 4 years. Now wave {E} must be a 3 wave structure, and we can see that we have already completed waves A and B, now forming wave C of {E} of (IV). We might form a triangle in wave [4] of C of {E}. Once this wave [4] and [5] are done we will get a sharp thrust which will be coming out of a 4 year long triangle. So it will be worth waiting for.
Regards, hasten
Technical analysis is a skill that improves with experience and study. Always be a student and keep learning. |
I have received a mail on my personal id from an ichart member regarding bharti airtel that i have analysed on 17 jan 2012.i am giving the answer one by one here
First question was :-
Bharti now trading at 50 rupees higher then your recommend price what should be target ?
As i told earlier bharti forming symmetrical triangle,since 2007 .so one can say that bharti was in consolidation since approximately 4 years .In the 'triangular consolidation' view, We might form a triangle in wave [4] of C of {E}. It seems that we prices have completed an important 4 wave ,now we are in wave 5 (it is nearing completion of a 5 wave advance), we are considering a leading diagonal pattern. any weekly closing above 413 will
confirmed triangle breakout.till than trail with sl .
second question was :-
elliott wave is very complicated theory ,could i handle this type of complicated subject?
When you started learning say maths or Science did you ask your teacher how can I understand this complicated subject?No .Isnt it? If we have keenness to learn and grow there is no boundary .
Disclaimer :This is my personal opinion , this is not a solicitation to buy or sell. I do not accept responsibility for financial decisions taken by any forum member . The aim is to provide a reasonably accurate picture related to opportunities based on technical charts. Please be confident on yourself too before investing.(I have some personal interest in bharti airtel )
Regards, hasten
Defeat is not final when you fall down. It is final when you can't get up.
Last edited by hasten on Fri Feb 03, 2012 7:02 pm; edited 1 time in total |
|
| Back to top |
|
|
DEVIKAUSR
White Belt
Joined: 08 Mar 2010
Posts: 92
|
| Post: #135 Posted: Fri Feb 03, 2012 7:44 am Post subject: well said |
|
|
Defeat is not final when you fall down. It is final when you can't get up.
goodmoring sir very well said
|
|
| Back to top |
|
|
|
|
You cannot post new topics in this forum
You cannot reply to topics in this forum
You cannot edit your posts in this forum
You cannot delete your posts in this forum
You cannot vote in polls in this forum
You can attach files in this forum
You can download files in this forum
|
Powered by phpBB © 2001, 2005 phpBB Group
|
|
|


