|
|
| View previous topic :: View next topic |
| Author |
MY CHART (AND YOUR TOO.............) |
hasten
White Belt

Joined: 30 Jun 2011
Posts: 216
|
Post: #136  Posted: Fri Feb 03, 2012 9:50 am Post subject: Re: Nifty rising in acceleration channel, wave [3] not yet d Posted: Fri Feb 03, 2012 9:50 am Post subject: Re: Nifty rising in acceleration channel, wave [3] not yet d |
 |
|
| hasten wrote: | Nifty may not have finished wave [3] as of yet, we may be in wave (5) instead of [5], so there is some upside left still in this move and it looks like we may be headed for 5400 for sure. Look for wave (5) targets around 5300 5350 levels. Prices are rising in the acceleration channel still, we must break it to form wave [4]. Also spot the ZLR formation on MACD on wave (4), and RSI snapping back from OS levels. Prices may target upper channel boundary for wave (5).
Regards, hasten
Trend is your friend unless it is about to end! |
The acceleration channel in which the prices are rising with unfailing persistence, holds the key to any corrections in Nifty. Unless we break down from this channel, we won't start the much awaited wave [4] correction. (Kindly refer the channel in the post below)
4th waves are surprises so don't try to anticipate it, it may surprise by its occurrence or by delay in occurrence, so be careful. A lot of EWP experts warn against predicting the end to an extending 3rd wave.
one pt in the lables to help narrow down the probable count :
EWP fibbo guidelines for IMPULSES say - w3 (Max) = 425%xw1
In our case:
W1=4531-4800=269
W2=4800-4588=212
W3=4588-5290** (=ruffly 260 % x W1)
3.1 :4588-4783=195
3.2 :4783-4687=96(50%)
3.3 :4687-5217=530(272%)
3.4 :5217-5077=140(26.4%)
3.5 :5077-5290*=213 (approx =3.1, for extned 3rd)
(If these r widin the fibbo guidelines, we should expect W3.5 to end very soon!)
Regards, hasten
Experience is a hard teacher because she gives the test first, the lesson afterwards.
|
|
| Back to top |
|
 |
|
| |
hasten
White Belt
Joined: 30 Jun 2011
Posts: 216
|
| Post: #137 Posted: Sun Feb 05, 2012 10:34 pm Post subject: INR rally is at imp resistance area ! |
|
|
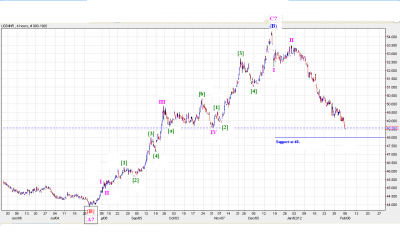
USDINR is now very close the support levels of 48. We may see a brief pause around this level. On Nifty too we are very close to completing a wave [3] extension. If USDINR gets supported around 48 we may see a brief pause to the Nifty rally that is going on. Based on our bullish views on INR, discussed in our earlier post, (link here), we may be in early stages of a INR rally against the USD. But if we take out 48 - 47.50 band we are headed for the 43 - 42 area for sure on USDINR. What patterns we make on our way will be interesting to watch. Right now we are just about at the terminus of the previous wave IV, lets see if we are offered any support here.
Regards, hasten
Making money in trading is not the hard part, KEEPING it is !
| Description: |
|
| Filesize: |
74.38 KB |
| Viewed: |
658 Time(s) |
|
|
|
| Back to top |
|
|
hasten
White Belt
Joined: 30 Jun 2011
Posts: 216
|
| Post: #138 Posted: Sun Feb 05, 2012 10:42 pm Post subject: Nifty Daily count update |
|
|
Nifty Daily count update
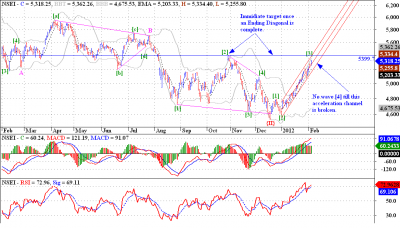
Friday's sharp rally was the 'thrust' from the triangle, and it has all the characteristics mentioned by Mr Elliott. Now this sharp thrust should fizzle out on Monday and I would be very glad if we make a small new weekly high on Monday and then tank, to complete the wave [4]. All is going well so far, but we need to break the acceleration channel of wave [3] to confirm formation of wave [4].
(Correction to latest post title:- 4532 should be replaced by 4588.05, wave [2] bottom.)
Regards, hasten
The best traders have developed an edge and most importantly, they trust their edge.
| Description: |
|
| Filesize: |
64.3 KB |
| Viewed: |
704 Time(s) |
|
|
|
| Back to top |
|
|
hasten
White Belt
Joined: 30 Jun 2011
Posts: 216
|
| Post: #139 Posted: Mon Feb 06, 2012 8:35 pm Post subject: |
|
|
Always remember what seniors have said about trying to forecast the end of 3rd wave extension, "don't try it"!
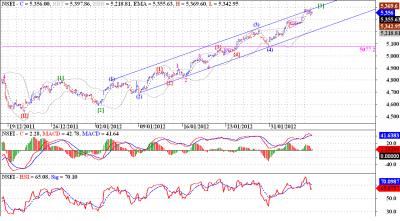
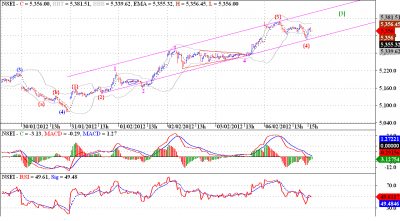
On hourly we are very close to the upper channel boundary, so it can be said that give or take a few points we might be very close to the wave [3] top. This wave (5) of [3] has been especially hard to label, because of the weird waves {1} and {2}. Today I have taken another shot at labeling this wave (5), please look at the 10 min chart for greater detail. with this labeling we get possible target for wave {5} of (5) at 5411 - 5450 levels. Once again we can only wait and watch where this wave (5) of [3] actually ends.
Regards, hasten
Discipline,not brains,make the trader's bank account swell.
| Description: |
|
| Filesize: |
53.53 KB |
| Viewed: |
664 Time(s) |
|
| Description: |
|
| Filesize: |
50.13 KB |
| Viewed: |
659 Time(s) |
|
|
|
| Back to top |
|
|
hasten
White Belt
Joined: 30 Jun 2011
Posts: 216
|
| Post: #140 Posted: Wed Feb 08, 2012 12:01 am Post subject: continues consolidation today ! Support at 5330 - 5300 ! |
|
|
Yesterday's and today's price action on Nifty is looking corrective. We got a support zone of around 5330 - 5300 range. Below 5300 we may correct deeper towards 5265 - 5235. If we get supported in this band we may see higher highs again in this trend. As per EWP wave {4} is in the making, we might see wave {5} of (5) if we get supported at 5330 - 5300 band.
Regards, hasten
Nothing can b changed by changing the face,But everything can b changed by facing the change....
| Description: |
|
| Filesize: |
49.95 KB |
| Viewed: |
664 Time(s) |
|
|
|
| Back to top |
|
|
hasten
White Belt
Joined: 30 Jun 2011
Posts: 216
|
| Post: #141 Posted: Wed Feb 08, 2012 5:53 pm Post subject: Nifty rangebound within 5325 - 5400 range ! |
|
|
Nifty is range bound in the 5325 - 5400 range(First Two Horizontal Line ). Once prices break out from this range we may see 5520 - 5640 - 5700. If we break down we may correct till 5075 levels.
Regards, hasten
Trading is easy, you don’t need fancy just buy when it’s going up and sell when it’s going down, that’s all there is to it.
| Description: |
|
| Filesize: |
52.44 KB |
| Viewed: |
796 Time(s) |
|
|
|
| Back to top |
|
|
hasten
White Belt
Joined: 30 Jun 2011
Posts: 216
|
| Post: #142 Posted: Thu Feb 09, 2012 6:46 pm Post subject: Finally breaks out of 5325 - 5400 range on 4th day! |
|
|
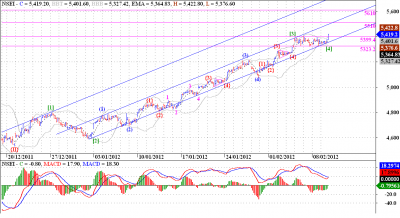
This hourly chart shows that we have completed an almost 3 and 1/2 day correction, in possibly wave [4]. Now we have broken out of the 5325 - 5400 range after 3 and 1/2 days, so we can expect this up move to carry some distance, before it loses steam. I have 5510 - 5610 in sight in the near term. But we need to remain above 5400 for this view to materialize, if we slip back into the trading range again, then this sideways action may continue further.
Regards,hasten
Efforts r never waste even when it leads to disappointing results, becauz it always makes u more prepared, stronger,capable and experienced.
| Description: |
|
| Filesize: |
52.61 KB |
| Viewed: |
675 Time(s) |
|
|
|
| Back to top |
|
|
hasten
White Belt
Joined: 30 Jun 2011
Posts: 216
|
| Post: #143 Posted: Thu Feb 09, 2012 6:51 pm Post subject: Expect fireworks ! |
|
|
This 10min chart shows the details of this double three pattern which formed on Nifty. We can see a flat followed by a zigzag and finally finished up by a triangle. Such sideways patterns suggest exceptional strength in the markets and we may exploit the maximum target potential for this wave [5]. Also an important point here is that if this double three pattern was indeed wave [4], we have not even completed 14.6% correction of wave [3], now that may happen because of exceptional strength of wave [3] of exceptionally strong 'anticipated' wave [5]. Only time will tell what actually will happen.
Disclaimer :This is my personal opinion , this is not a solicitation to buy or sell. I do not accept responsibility for financial decisions taken by any forum member . The aim is to provide a reasonably accurate picture related to opportunities based on technical charts. Please be confident on yourself too before investing.
Regards, hasten
Defeat is not final when you fall down. It is final when you can't get up.
| Description: |
|
| Filesize: |
50.78 KB |
| Viewed: |
728 Time(s) |
|
|
|
| Back to top |
|
|
sanmen
White Belt
Joined: 28 Apr 2008
Posts: 88
Location: Delhi
|
| Post: #144 Posted: Thu Feb 09, 2012 8:11 pm Post subject: |
|
|
Hi Hasten
Gr8 stuff !!!! 
i also tend to do a bit of EW (though i get swept away in waves most of the times  )...just sharing my view )...just sharing my view
i feel we are not into the 5th of Wave 3 of this upmove...the wave 4 of the larger degree Wave 3 ended in a ABCDE pattern....what you have shown as a triangle pattern, can be 1 and 2 of 5th (of 3)....
have no targets for the end of this wave...we have quite a few events coming up such as election results, budget etc which will define further movements...
whats your view on this....
PS: your disclaimer applies here as well
MV/Mayur: pl comment friends!!!!!!
regards
Sandeep
|
|
| Back to top |
|
|
hasten
White Belt
Joined: 30 Jun 2011
Posts: 216
|
| Post: #145 Posted: Fri Feb 10, 2012 10:10 am Post subject: |
|
|
| sanmen wrote: | Hi Hasten
Gr8 stuff !!!!
i also tend to do a bit of EW (though i get swept away in waves most of the times )...just sharing my view
i feel we are not into the 5th of Wave 3 of this upmove...the wave 4 of the larger degree Wave 3 ended in a ABCDE pattern....what you have shown as a triangle pattern, can be 1 and 2 of 5th (of 3)....
have no targets for the end of this wave...we have quite a few events coming up such as election results, budget etc which will define further movements...
whats your view on this....
PS: your disclaimer applies here as well
MV/Mayur: pl comment friends!!!!!!
regards
Sandeep |
Its very difficult to discuss the waves like this it would be real nice if you
could post a chart. Or may be mark corrections on my chart.
Now come to my points .As i said earlier 4th waves are surprises so don't try to anticipate it, it may surprise by its occurrence or by delay in occurrence, so be careful. A lot of EWP experts warn against predicting the end to an extending 3rd wave.
If these r with in the fibonacci guidelines, we can not extend wave 3 .
3.1 :4588-4783=195
3.2 :4783-4687=96(50%)
3.3 :4687-5217=530(272%)
3.4 :5217-5077=140(26.4%)
3.5 :5077-5390*=313 (approx =4.1, for extned 3rd)
Always remember what seniors have said about trying to forecast the end of 3rd wave extension, "don't try it"!
Regards, hasten
Experience is a hard teacher because she gives the test first, the lesson afterwards.
|
|
| Back to top |
|
|
sanmen
White Belt
Joined: 28 Apr 2008
Posts: 88
Location: Delhi
|
| Post: #146 Posted: Fri Feb 10, 2012 12:49 pm Post subject: |
|
|
hi Hasten
thanx!...i made a typo error...i wanted to say "i feel we are now into the 5th of Wave 3 of this upmove" instead i wrote "not"...sorry for the typo
this must be confusing...i fully agree and also acknowledged that predicting top of 3 is a crime..not doing it..
rgds
Sandeep
|
|
| Back to top |
|
|
hasten
White Belt
Joined: 30 Jun 2011
Posts: 216
|
| Post: #147 Posted: Fri Feb 10, 2012 11:56 pm Post subject: Nifty looking good for correction ! |
|
|
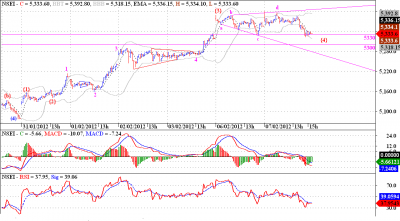
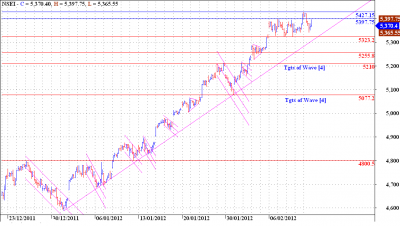
Hourly Support and Resistance Chart
In this chart red lines show support and resistance levels, and blue line show resistance. We can short with a stop loss of 5400, with targets around 5200 levels, and below that 5100 - 5075 levels.
Regards, hasten
Never do anything you can't stand for.. Remember once its been done, there is no turning back.Life has no rewind learn to play it right ..
| Description: |
|
| Filesize: |
49.21 KB |
| Viewed: |
613 Time(s) |
|
|
|
| Back to top |
|
|
hasten
White Belt
Joined: 30 Jun 2011
Posts: 216
|
| Post: #148 Posted: Fri Feb 10, 2012 11:58 pm Post subject: Nifty looking good for correction ! |
|
|
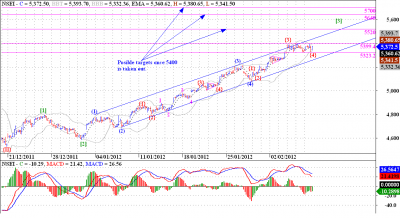
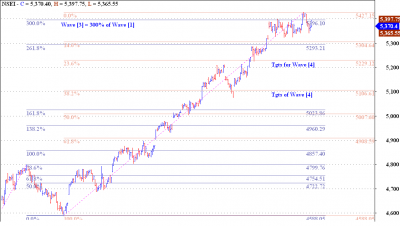
Hourly Fibonacci Chart
We can see that wave [3] is 300% of wave [1], now we can expect a wave [4]. Channeling technique of EWP gives target around 5200 levels.
Regards, hasten
Good things come to those who wait, but the best things come to those who work for it.[/u]
| Description: |
|
| Filesize: |
52.41 KB |
| Viewed: |
640 Time(s) |
|
|
|
| Back to top |
|
|
hasten
White Belt
Joined: 30 Jun 2011
Posts: 216
|
| Post: #149 Posted: Sat Feb 11, 2012 12:06 am Post subject: Nifty looking good for correction ! |
|
|
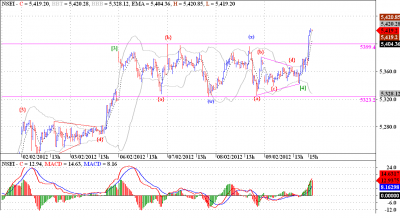
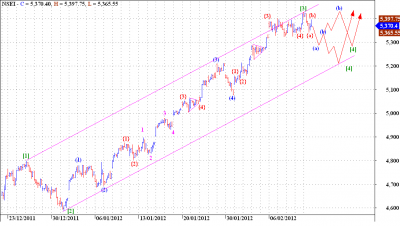
Hourly EW Chart
Nifty came down today and took out the low of wave {4}in 5 waves. There are a couple of possibilities, discussed here. Either we may form a flat with wave (a) around 5300. But if we break this level we may go further down to 5210 - 5230 levels. I have marked important support and resistance levels, and fibonacci levels as well for clearer understanding.
Disclaimer :This is my personal opinion , this is not a solicitation to buy or sell. I do not accept responsibility for financial decisions taken by any forum member . The aim is to provide a reasonably accurate picture related to opportunities based on technical charts. Please be confident on yourself too before investing.
Regards, hasten
Failure is only a temporary change in direction to set you straight for your next success...
| Description: |
|
| Filesize: |
48.73 KB |
| Viewed: |
702 Time(s) |
|
|
|
| Back to top |
|
|
apka
Black Belt

Joined: 13 Dec 2011
Posts: 6137
|
| Post: #150 Posted: Sat Feb 18, 2012 9:02 am Post subject: |
|
|
| hello hasten.... Awaiting ur updates
|
|
| Back to top |
|
|
|
|
You cannot post new topics in this forum
You cannot reply to topics in this forum
You cannot edit your posts in this forum
You cannot delete your posts in this forum
You cannot vote in polls in this forum
You can attach files in this forum
You can download files in this forum
|
Powered by phpBB © 2001, 2005 phpBB Group
|
|
|


