| View previous topic :: View next topic |
| Author |
MY CHART (AND YOUR TOO.............) |
hasten
White Belt

Joined: 30 Jun 2011
Posts: 216
|
Post: #151  Posted: Sat Feb 18, 2012 11:05 am Post subject: Posted: Sat Feb 18, 2012 11:05 am Post subject: |
 |
|
| apka wrote: | | hello hasten.... Awaiting ur updates |
Site admin SwingTrader a week ago committed me that he will give some opinion on my thread but yet there is no opinion from him, sorry i could not post the chart until he will give his opinion.
Please forgive me
Regards, hasten
Price is the ultimate indicator. Everything else is secondary.
|
|
| Back to top |
|
 |
|
|
|
maddyprincess
White Belt
Joined: 15 Nov 2011
Posts: 160
|
| Post: #152 Posted: Fri Feb 24, 2012 1:53 pm Post subject: |
|
|
Hastenji, actually we were learning from your chart patterns
Anyway you have quoted reason for your inability to post charts
It is sad 
|
|
| Back to top |
|
|
KatrinaaDP
White Belt
Joined: 11 Sep 2010
Posts: 95
|
| Post: #153 Posted: Fri Feb 24, 2012 3:57 pm Post subject: |
|
|
| hasten Sir please post charts, we r waiting
|
|
| Back to top |
|
|
hasten
White Belt
Joined: 30 Jun 2011
Posts: 216
|
| Post: #154 Posted: Fri Feb 24, 2012 11:05 pm Post subject: |
|
|
| maddyprincess wrote: | Hastenji, actually we were learning from your chart patterns
Anyway you have quoted reason for your inability to post charts
It is sad |
Please forgive me
Regards, hasten
Never do anything you can't stand for.. Remember once its been done, there is no turning back.Life has no rewind learn to play it right ..
|
|
| Back to top |
|
|
hasten
White Belt
Joined: 30 Jun 2011
Posts: 216
|
| Post: #155 Posted: Fri Feb 24, 2012 11:07 pm Post subject: |
|
|
| KatrinaaDP wrote: | | hasten Sir please post charts, we r waiting |
Please forgive me
Regards, hasten
Technical analysis is a skill that improves with experience and study. Always be a student and keep learning.
|
|
| Back to top |
|
|
SwingTrader
Site Admin
Joined: 11 Aug 2006
Posts: 2903
Location: Hyderabad, India
|
| Post: #156 Posted: Mon Feb 27, 2012 12:42 pm Post subject: |
|
|
Hasten,
Your charts look solid. I can't post more informed opinion than that because I am not too familiar with EWs. But from whatever I know, your charts look very good.
Please continue to post your charts & updates for the sake of others. but I will not be able to regularly follow your charts and post my comments (I don't get time to update my forum topics itself  ). But as promised I am posting my opinion here.... ). But as promised I am posting my opinion here....
Regards.
_________________
Srikanth Kurdukar
@SwingTrader |
|
| Back to top |
|
|
maddyprincess
White Belt
Joined: 15 Nov 2011
Posts: 160
|
| Post: #157 Posted: Mon Feb 27, 2012 1:09 pm Post subject: |
|
|
| SwingTrader wrote: | Hasten,
Your charts look solid. I can't post more informed opinion than that because I am not too familiar with EWs. But from whatever I know, your charts look very good.
Please continue to post your charts & updates for the sake of others. but I will not be able to regularly follow your charts and post my comments (I don't get time to update my forum topics itself ). But as promised I am posting my opinion here....
Regards. |
Thanks ST !!!!!! 
|
|
| Back to top |
|
|
hasten
White Belt
Joined: 30 Jun 2011
Posts: 216
|
| Post: #158 Posted: Mon Feb 27, 2012 2:51 pm Post subject: |
|
|
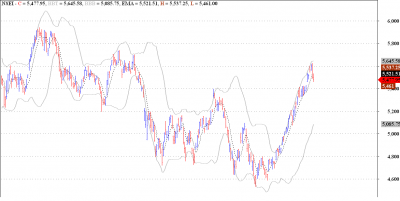
The daily chart for Nifty has Bollinger Bands applied to it. It can be seen that both the bands are quite a distance apart after the stupendous approx 25% rally. The upper and lower bands need to catch up and narrow the gap down for some consolidation.
Regards. hasten
It always seems impossible until it's done.
| Description: |
|
| Filesize: |
45.48 KB |
| Viewed: |
602 Time(s) |
|
Last edited by hasten on Mon Feb 27, 2012 2:53 pm; edited 1 time in total |
|
| Back to top |
|
|
opportunist
White Belt
Joined: 27 Apr 2010
Posts: 356
|
| Post: #159 Posted: Mon Feb 27, 2012 2:53 pm Post subject: Re: Nifty looking good for correction ! |
|
|
| hasten wrote: | Hourly EW Chart
Nifty came down today and took out the low of wave {4}in 5 waves. There are a couple of possibilities, discussed here. Either we may form a flat with wave (a) around 5300. But if we break this level we may go further down to 5210 - 5230 levels. I have marked important support and resistance levels, and fibonacci levels as well for clearer understanding.
Disclaimer :This is my personal opinion , this is not a solicitation to buy or sell. I do not accept responsibility for financial decisions taken by any forum member . The aim is to provide a reasonably accurate picture related to opportunities based on technical charts. Please be confident on yourself too before investing.
Regards, hasten
Failure is only a temporary change in direction to set you straight for your next success... |
Good analysis maddy. It showed how effective fibo can be ...made a perfect turn at 300%. Now as per your other chart showing a channel climb we can safely assume that nifty will correct to 5200 levels at least
Regards,
Oppo
|
|
| Back to top |
|
|
hasten
White Belt
Joined: 30 Jun 2011
Posts: 216
|
| Post: #160 Posted: Mon Feb 27, 2012 2:54 pm Post subject: |
|
|
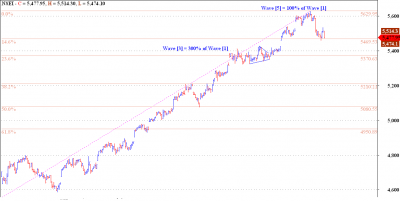
Nifty - Hourly Fibonnacci
The Fibonacci relations suggest that wave [3] was 300% of wave [1]. Wave [5] was 100% of wave [1]. Now we should retrace a fibonacci level of this wave I. We may see good support around 23.6% levels. Eventually we might end the complete correction within the 38.2% to 61.8% band.
Regards, hasten
Price is the ultimate indicator. Everything else is secondary.
| Description: |
|
| Filesize: |
32.69 KB |
| Viewed: |
641 Time(s) |
|
|
|
| Back to top |
|
|
hasten
White Belt
Joined: 30 Jun 2011
Posts: 216
|
| Post: #161 Posted: Mon Feb 27, 2012 3:02 pm Post subject: Re: Nifty looking good for correction ! |
|
|
| opportunist wrote: | | hasten wrote: | Hourly EW Chart
Nifty came down today and took out the low of wave {4}in 5 waves. There are a couple of possibilities, discussed here. Either we may form a flat with wave (a) around 5300. But if we break this level we may go further down to 5210 - 5230 levels. I have marked important support and resistance levels, and fibonacci levels as well for clearer understanding.
Disclaimer :This is my personal opinion , this is not a solicitation to buy or sell. I do not accept responsibility for financial decisions taken by any forum member . The aim is to provide a reasonably accurate picture related to opportunities based on technical charts. Please be confident on yourself too before investing.
Regards, hasten
Failure is only a temporary change in direction to set you straight for your next success... |
Good analysis maddy. It showed how effective fibo can be ...made a perfect turn at 300%. Now as per your other chart showing a channel climb we can safely assume that nifty will correct to 5200 levels at least
Regards,
Oppo |
Sorry but my self hasten ....m not maddy
Regards, hasten
Discipline,not brains,make the trader's bank account swell.
|
|
| Back to top |
|
|
hasten
White Belt
Joined: 30 Jun 2011
Posts: 216
|
| Post: #162 Posted: Mon Feb 27, 2012 3:03 pm Post subject: Nifty - Elliott Wave Analysis. |
|
|
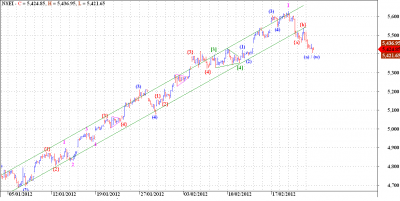
Hourly chart shows that we have convincingly broken the rising channel. The pullback after the break down was resisted at the lower channel line. Now classical technical analysis would call this a confirmation of the down trend. But as EWP practitioners we know that an initial 3 wave decline, may mean one of three possibilities,
1. A DZZ or TZZ correction.
2. A flat correction.
3. A triangle (but since this is wave II as per our EW count this possibility is ruled out).
So going by the first possibility we get even deeper correction, but only after completing a small pullback. And going by the second possibility we may see a rise to the high of 5630 levels in 3 waves and a sharp cut in 5 waves around the bottom of this wave (a) to complete wave (c).
Since this wave I was very sharp, we might get into a consolidation mode for a couple of weeks, before we resume the up trend.
Disclaimer :This is my personal opinion , this is not a solicitation to buy or sell. I do not accept responsibility for financial decisions taken by any forum member . The aim is to provide a reasonably accurate picture related to opportunities based on technical charts. Please be confident on yourself too before investing.
Regards, hasten
Nothing can b changed by changing the face,But everything can b changed by facing the change....
| Description: |
|
| Filesize: |
39.58 KB |
| Viewed: |
706 Time(s) |
|
|
|
| Back to top |
|
|
vinay28
Black Belt

Joined: 24 Dec 2010
Posts: 11748
|
| Post: #163 Posted: Mon Feb 27, 2012 4:06 pm Post subject: |
|
|
| hasten, these charts seem to be as of yesterday. please post including today. thanks
|
|
| Back to top |
|
|
hasten
White Belt
Joined: 30 Jun 2011
Posts: 216
|
| Post: #164 Posted: Mon Feb 27, 2012 4:23 pm Post subject: |
|
|
| vinay28 wrote: | | hasten, these charts seem to be as of yesterday. please post including today. thanks |
After 8 pm be patient
Regards, hasten
Good things come to those who wait, but the best things come to those who work for it.
|
|
| Back to top |
|
|
nsinojia
Yellow Belt

Joined: 21 Dec 2009
Posts: 624
|
| Post: #165 Posted: Mon Feb 27, 2012 6:09 pm Post subject: |
|
|
[quote="hasten"] | vinay28 wrote: | | hasten, these charts seem to be as of yesterday. please post including today. thanks |
[b]After 8 pm be patient
 done as desired by you hastenji but you will have to prove to me who u are done as desired by you hastenji but you will have to prove to me who u are
Last edited by nsinojia on Mon Feb 27, 2012 8:18 pm; edited 1 time in total |
|
| Back to top |
|
|
|


