|
|
| View previous topic :: View next topic |
| Author |
MY CHART (AND YOUR TOO.............) |
hasten
White Belt

Joined: 30 Jun 2011
Posts: 216
|
Post: #31  Posted: Sun Dec 25, 2011 9:39 pm Post subject: GOLD Posted: Sun Dec 25, 2011 9:39 pm Post subject: GOLD |
 |
|
Gold got resisted around 1640 levels, but is still below our preferred count invalidation levels of 1666. There is an alternate possibility in Gold which is even more bearish in long term, but in the short term may just have another leg up remaining. We may be forming a series of 1-2/1-2 waves down, and wave 2 may target the area around 1685, that's the 61.8% retracement of the fall from 1760 levels. So Gold like many other markets is poised to take further signals from DI.
Regards, hasten
The best trading method is to take advantage of the crowd's greed and fear.
| Description: |
|
| Filesize: |
91.01 KB |
| Viewed: |
551 Time(s) |
|
Last edited by hasten on Sun Dec 25, 2011 9:53 pm; edited 1 time in total |
|
| Back to top |
|
 |
|
| |
hasten
White Belt
Joined: 30 Jun 2011
Posts: 216
|
| Post: #32 Posted: Sun Dec 25, 2011 9:49 pm Post subject: USDINR |
|
|
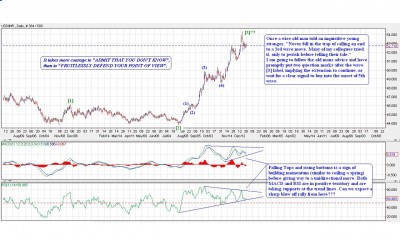
USDINR has rallied like a rocket since middle of last year. We can count waves on the chart, but at it is rallying in wave [3] it might be a risky business to do so. It is better to enjoy the move rather than predict where it might end. As you might observe wave [2] was prolonged and deep so by the guideline of alternation wave [4] will be sharp and shallow. Lets see whats in store for us in USDINR. But should dollar rally we should continue to see sharp slide in the rupee, and steep rises in Petrol Prices (Alas, the age of cross subsidies).
Regards, hasten
If you don’t follow the stock market, you are missing some amazing drama.
| Description: |
|
| Filesize: |
196.49 KB |
| Viewed: |
563 Time(s) |
|
|
|
| Back to top |
|
|
hasten
White Belt
Joined: 30 Jun 2011
Posts: 216
|
| Post: #33 Posted: Sun Dec 25, 2011 10:20 pm Post subject: Bank Nifty |
|
|
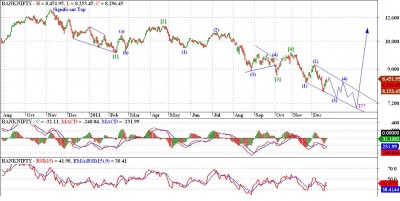
Bank Nifty may be forming an ED on similar lines to Nifty. We can count a clear 5 wave down move on Bank Nifty, the only glitch is that the wave [4] is overlapping wave [1] by just a whisker, its against the rules, but looking at the patterns in Nifty we should be ready for a bounce in Bank Nifty if Nifty gets supported around 5500 - 5400 levels. For Bank Nifty those levels could be around 9800 - 9600 levels.
Regards, hasten
Always follow trading plan to get profit in the long run.
| Description: |
|
| Filesize: |
154.24 KB |
| Viewed: |
566 Time(s) |
|
Last edited by hasten on Tue Dec 27, 2011 11:11 pm; edited 1 time in total |
|
| Back to top |
|
|
hasten
White Belt
Joined: 30 Jun 2011
Posts: 216
|
| Post: #34 Posted: Tue Dec 27, 2011 1:57 pm Post subject: GPLD |
|
|
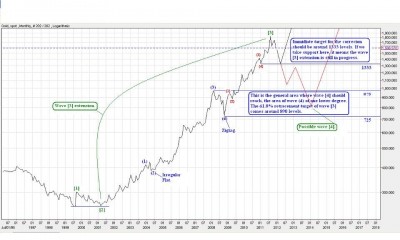
USDGold has rallied spectacularly, almost 11 years of bull run, with small unnoticeable corrections in between. USDGold went from 250 odd levels to over 1900 levels, a 660% rise. But as they every party eventually comes to an end. Here in USDGold has completed wave [3] and should now come down in wave [4]. Wave [2] was sharp and deep, that makes a flat or a triangle a possibility in wave [4]. Another guideline that helps us, is that wave [4] should come down to the wave (4) of previous lower degree. The range for this wave lower degree comes around 975 - 725 levels on closing basis. The third guideline is that of fibonacci relationships in adjacent waves. The 38.2%, 50% and 61.8% levels come around 1285, 1085 and 890. So if we follow all the three guidelines, we are looking a an extended sideways action in USDGold for next few years and the lower boundary comes in the range of 975 - 725 (a.k.a deflationary depression).
But all hope is not lost, though I not at all hoping for anything at this moment, we can say that the wave [3] extension is not yet over, and in that case we may first test the levels around 1350 - 1300, and then go on to rally to much higher levels (a.k.a hyper inflation). Right now USDGold is poised around 1600 levels and there is still about 300 dollar fall we expect in Gold, so I am not very supportive of Gold bulls. If you cannot handle a bear market this is the best time to stand on the sidelines, till the picture becomes clearer.
Regards, hasten
Every dream has a price
| Description: |
|
| Filesize: |
89.64 KB |
| Viewed: |
584 Time(s) |
|
|
|
| Back to top |
|
|
anand1234
Yellow Belt

Joined: 17 Jul 2010
Posts: 830
|
| Post: #35 Posted: Tue Dec 27, 2011 6:36 pm Post subject: Re: Bank Nifty |
|
|
| hasten wrote: | Bank Nifty may be forming an ED on similar lines to Nifty. We can count a clear 5 wave down move on Bank Nifty, the only glitch is that the wave [4] is overlapping wave [1] by just a whisker, its against the rules, but looking at the patterns in Nifty we should be ready for a bounce in Bank Nifty if Nifty gets supported around 5500 - 5400 levels. For Bank Nifty those levels could be around 7200 - 7000 levels.
Regards, hasten
Always follow trading plan to get profit in the long run.
|
hi...hasten
just quiry.......u mentioned if NF get supported around 5500 -5400 level...........but NF is trading around 4750 level...how it will get support from that??.....is it printing mistek??
thanks
anand
|
|
| Back to top |
|
|
hasten
White Belt
Joined: 30 Jun 2011
Posts: 216
|
| Post: #36 Posted: Tue Dec 27, 2011 11:09 pm Post subject: Re: Bank Nifty |
|
|
| anand1234 wrote: | | hasten wrote: | Bank Nifty may be forming an ED on similar lines to Nifty. We can count a clear 5 wave down move on Bank Nifty, the only glitch is that the wave [4] is overlapping wave [1] by just a whisker, its against the rules, but looking at the patterns in Nifty we should be ready for a bounce in Bank Nifty if Nifty gets supported around 5500 - 5400 levels. For Bank Nifty those levels could be around 7200 - 7000 levels.
Regards, hasten
Always follow trading plan to get profit in the long run.
|
hi...hasten
just quiry.......u mentioned if NF get supported around 5500 -5400 level...........but NF is trading around 4750 level...how it will get support from that??.....is it printing mistek??
thanks
anand |
I mean if nifty reaches around 5400-5500 levels .For Bank Nifty those levels could be around 9800 - 9600 .( MY mistake  ,I apologize) ,I apologize)
Regards. hasten
Kites rise highest against the wind, not with it.
|
|
| Back to top |
|
|
hasten
White Belt
Joined: 30 Jun 2011
Posts: 216
|
| Post: #37 Posted: Tue Dec 27, 2011 11:40 pm Post subject: NIFTY |
|
|
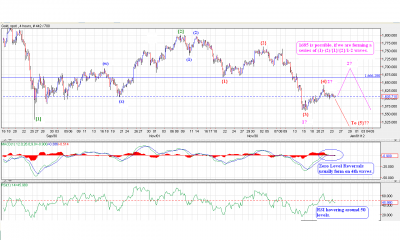
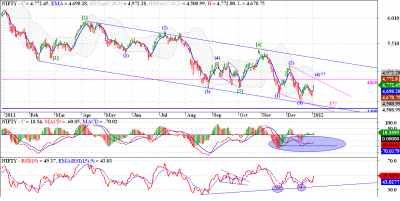
Nifty fell sharply today, but the fall is not convincing enough to count it as a 5 wave move, though if one tries hard one can do so. But if we follow the words of A J Frost then a count should catch you not the other way round.
Now there is a possibility of an ending diagonal in wave {c} and wave 5 of {c} should target around 4810. A caveat here, above 4830 the wave 5 of {c} becomes bigger than wave 3 of {c}, and wave 1 of {c} is already longer than wave 3 of {c}, and wave 3 cannot be the shortest of 1,3,5. All in all if we cross 4830, then this whole corrective count of wave (d) comes under scrutiny. Another possibility is that market may tank tomorrow and a DZZ correction is complete, and we will have to look for levels of 4500 - 4400 levels on Nifty.
Regards,hasten
Disclaimer :This is my personal opinion on nifty , this is not a solicitation to buy or sell. I do not accept responsibility for financial decesions taken by any forum memeber . The aim is to provide a reasonably accurate picture related to opportunities based on technical charts.
trading is easy, you don’t need nuthin fancy just buy when it’s going up and sell when it’s going down, that’s all there is to it.
| Description: |
|
| Filesize: |
96.82 KB |
| Viewed: |
569 Time(s) |
|
|
|
| Back to top |
|
|
rk_a2003
Black Belt

Joined: 21 Jan 2010
Posts: 2734
|
| Post: #38 Posted: Wed Dec 28, 2011 8:53 am Post subject: |
|
|
"trading is easy, you don’t need nuthin fancy just buy when it’s going up and sell when it’s going down, that’s all there is to it."
Good one.....  .But it takes all the TA to decide that it continues going up or it continues going down. .But it takes all the TA to decide that it continues going up or it continues going down.
|
|
| Back to top |
|
|
Arjun20
Yellow Belt
Joined: 23 Jun 2011
Posts: 945
|
| Post: #39 Posted: Wed Dec 28, 2011 9:57 am Post subject: |
|
|
Hi Hasten,
i don't have knowledge about EWA.
But can u pls comment seeing NF-hourly chart:
Whether y'day/today NF has given breakdown of Flag ?
Fall from 5100 to 4525 ( approx figures) gave pullback between 38.2-50 % retrace levels and it seems to be Flag breakdown.
rgds
Arjun
|
|
| Back to top |
|
|
hasten
White Belt
Joined: 30 Jun 2011
Posts: 216
|
| Post: #40 Posted: Thu Dec 29, 2011 12:19 am Post subject: |
|
|
| Arjun20 wrote: | Hi Hasten,
i don't have knowledge about EWA.
But can u pls comment seeing NF-hourly chart:
Whether y'day/today NF has given breakdown of Flag ?
Fall from 5100 to 4525 ( approx figures) gave pullback between 38.2-50 % retrace levels and it seems to be Flag breakdown.
rgds
Arjun |
Please post your chart , and let me know what exactly you want to know. may be after seeing your chart , i will able to comment on your query .
Regards, hasten
Discipline,not brains,make the trader's bank account swell.
|
|
| Back to top |
|
|
hasten
White Belt
Joined: 30 Jun 2011
Posts: 216
|
| Post: #41 Posted: Thu Dec 29, 2011 12:24 am Post subject: NIFTY |
|
|
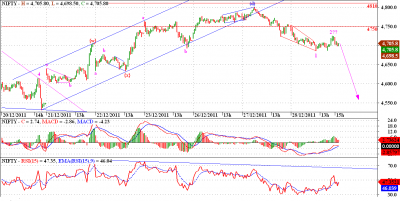
Nifty seems to have completed a corrective pattern in wave (d). Also we had a leading diagonal in wave 1 down, also there seems to be an expanded flat correction forming in wave 2. What should follow is wave 3 that should be dynamic in nature. Note MACD forming a ZLR, and RSI might face resistance around 50 levels. Lets see what prices do and whether they confirm our view, or not.
Regards, hasten
I strive to put in perfect trades again and again, every time, always.
| Description: |
|
| Filesize: |
63.49 KB |
| Viewed: |
630 Time(s) |
|
|
|
| Back to top |
|
|
hasten
White Belt
Joined: 30 Jun 2011
Posts: 216
|
| Post: #42 Posted: Thu Dec 29, 2011 1:42 pm Post subject: NIFTY |
|
|
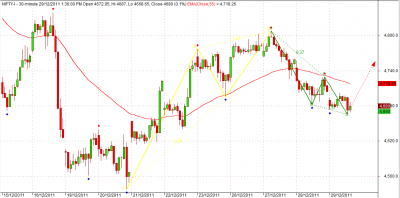
Nifty seems to be forming a BullisH Gartley's Crab pattern on the 30 min charts. it is a complex price pattern based on Fibonacci numbers/ratios. It is used to determine buy and sell signals by measuring retracements of a stock's up and down movement in price.
If the pattern has to materialize then in the short term Nifty should be headed up towards the range shown in the chart to complete forming point D and then we could see a retracement to the expected target range(near 4780) if the pattern holds. Typically, price declines from entry point D could be 61.8% or more of CD.
Regards, hasten
Every dream has a price
| Description: |
|
| Filesize: |
45.2 KB |
| Viewed: |
612 Time(s) |
|
|
|
| Back to top |
|
|
hasten
White Belt
Joined: 30 Jun 2011
Posts: 216
|
| Post: #43 Posted: Fri Dec 30, 2011 9:50 am Post subject: ACC |
|
|
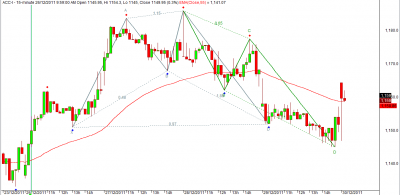
Gartley's Bullish Butterfly pattern in ACC Future. (15 min tf) .
Regards, hasten
A kid asked swami vivekanand
'Sab kuch khone s zyada bura kya h?
Swamiji : wo umeed khona jiske bharose pr hum sab kuch vapas paa skte hai.'
| Description: |
|
| Filesize: |
45.85 KB |
| Viewed: |
546 Time(s) |
|
|
|
| Back to top |
|
|
hasten
White Belt
Joined: 30 Jun 2011
Posts: 216
|
| Post: #44 Posted: Tue Jan 03, 2012 11:42 pm Post subject: NIFTY |
|
|
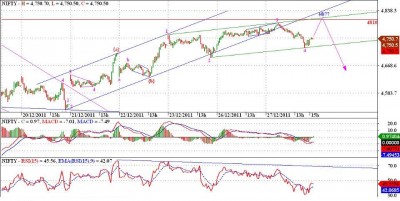
Nifty posted huge gains today, but looking at the daily chart, the ending diagonal scenario is still in contention. We may be forming a zigzag in wave (4), and the target for wave {c} will be in the range of 4860, by the guideline of equality (wave {a} == wave {c}). But once beyond this level we may have to look at possible alternatives to put the price action in perspective, and just to give you an early glimpse of the things that may follow such a break out, we may actually make a new high on Nifty. But should we get resisted around 4860 levels on Nifty, we will go down again in our previous target zone of 4500 - 4300 levels, the target zone is extended lower till 4300, due to this new development in wave (4). So watch the prices around 4860 levels, and see what Nifty does from there. The minimum requirement for this pattern however is to take out the high of wave {a} around 4773 levels.
Regards, hasten
There is a way to do it better-- find it.
| Description: |
|
| Filesize: |
64.41 KB |
| Viewed: |
562 Time(s) |
|
|
|
| Back to top |
|
|
nsinojia
Yellow Belt
Joined: 21 Dec 2009
Posts: 624
|
| Post: #45 Posted: Wed Jan 04, 2012 9:32 am Post subject: |
|
|

|
|
| Back to top |
|
|
|
|
You cannot post new topics in this forum
You cannot reply to topics in this forum
You cannot edit your posts in this forum
You cannot delete your posts in this forum
You cannot vote in polls in this forum
You can attach files in this forum
You can download files in this forum
|
Powered by phpBB © 2001, 2005 phpBB Group
|
|
|


