|
|
| View previous topic :: View next topic |
| Author |
MY CHART (AND YOUR TOO.............) |
hasten
White Belt

Joined: 30 Jun 2011
Posts: 216
|
Post: #46  Posted: Wed Jan 04, 2012 10:15 am Post subject: Posted: Wed Jan 04, 2012 10:15 am Post subject: |
 |
|

|
|
| Back to top |
|
 |
|
| |
hasten
White Belt
Joined: 30 Jun 2011
Posts: 216
|
| Post: #47 Posted: Thu Jan 05, 2012 1:03 pm Post subject: Soybean |
|
|
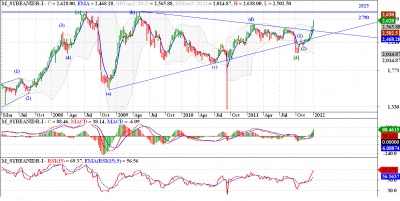
Soybean was developing a big triangle since July 2008. The triangle has been forming for approximately 2 and half years now. And this patten seems to have completed in Oct 2011. The indicators also support the triangle formation. We are currently in wave (3) of the thrust which follows a triangle, and the primary target zone for wave (3) comes around 2790 - 2825 range. We might pause here for a while, but there is no doubt that Soybean is headed much higher from current levels.
Regards, hasten
Don’t let the outcome of one trade alter your trading discipline. One trade doesn’t make a system..
| Description: |
|
| Filesize: |
63.68 KB |
| Viewed: |
643 Time(s) |
|
Last edited by hasten on Sun Feb 19, 2012 1:07 am; edited 1 time in total |
|
| Back to top |
|
|
hasten
White Belt
Joined: 30 Jun 2011
Posts: 216
|
| Post: #48 Posted: Thu Jan 05, 2012 8:30 pm Post subject: TATA MOTORS |
|
|
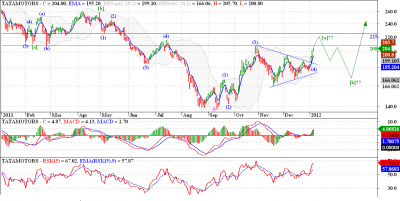
Tata Motors is rising well after resolving a triangle in wave (4) as shown on the chart. Prices may be forming a big flat correction in TML. We completed the A wave, now rising in wave [a] of B. The target for this wave (5) of [a] should be between 208 - 225 range, preferably towards the higher boundary. After that we may come down in wave [b].
Regards, hasten
You know my method. It is founded upon the observation of trifles. It is, of course, a trifle, but there is nothing so important as trifles.
| Description: |
|
| Filesize: |
63.98 KB |
| Viewed: |
668 Time(s) |
|
|
|
| Back to top |
|
|
vinay28
Black Belt

Joined: 24 Dec 2010
Posts: 11748
|
| Post: #49 Posted: Thu Jan 05, 2012 8:32 pm Post subject: |
|
|
a "trifle" late in the tip, hasten? 
|
|
| Back to top |
|
|
hasten
White Belt
Joined: 30 Jun 2011
Posts: 216
|
| Post: #50 Posted: Fri Jan 06, 2012 3:33 pm Post subject: BANKNIFTY |
|
|
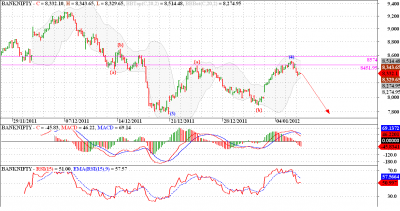
Banknifty has completed all the requirements of a zigzag correction. We can also count a 5 wave advance in wave {c} on a lower time frame. But on Nifty we have not yet crossed the top of wave {a}, the minimum requirement of a zigzag. But all the EWP rules and guidelines were formulated by observing the markets, not the other way round, so as always markets reign supreme, and we can only do well if we follow it. I believe Banknifty has tipped its hand and below 8264.35 we should fall hard.
So now it is interesting to observe whether Nifty pulls Banknifty up to complete the zigzag, or Banknifty just falls taking Nifty with it!
Regards, hasten
They Say We Move The Markets, I Say I am Just Happy To Follow !!!!!
Market Is The Only Warfield Where You Will Surely Win Only If You Completely Surrender Yourself (to the flow)...
| Description: |
|
| Filesize: |
56.33 KB |
| Viewed: |
489 Time(s) |
|
| Description: |
|
| Filesize: |
53.92 KB |
| Viewed: |
511 Time(s) |
|
Last edited by hasten on Fri Jan 06, 2012 3:41 pm; edited 1 time in total |
|
| Back to top |
|
|
nsinojia
Yellow Belt

Joined: 21 Dec 2009
Posts: 624
|
| Post: #51 Posted: Fri Jan 06, 2012 3:38 pm Post subject: |
|
|
|
|
|
| Back to top |
|
|
hasten
White Belt
Joined: 30 Jun 2011
Posts: 216
|
| Post: #52 Posted: Sun Jan 08, 2012 10:27 pm Post subject: CRUDE OIL |
|
|
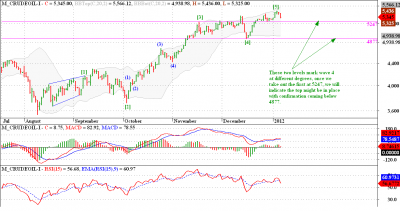
This is a graph of MCX Crude try and compare this with the on of International Crude, here . The MCX Crude chart and waves are a bit different. But we can be sure of the top being in place once we take out two important levels of 5247 and 4877. One caveat here though if we take out 5247 but fail to break 4877, we may have a remote chance of wave [5] extending, Once below 4877 we may test 4500 levels on crude.
Regards, hasten
Money is only the byproduct of any successful trade.
| Description: |
|
| Filesize: |
56.86 KB |
| Viewed: |
450 Time(s) |
|
|
|
| Back to top |
|
|
hasten
White Belt
Joined: 30 Jun 2011
Posts: 216
|
| Post: #53 Posted: Sun Jan 08, 2012 10:35 pm Post subject: NIFTY |
|
|
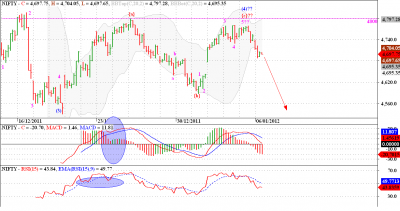
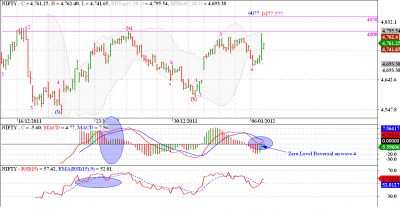
Nifty rose sharply from the support levels of 4690. Our wave 4 took form of an irregular flat. MACD also formed a clean zero level reversal. Now by using reverse fibonacci technique we can forecast the possible range for wave 5 from 4810 - 4850. Its still within our earlier resistance zone of 4800 - 4860. MACD is also setting up for a good negative divergence on wave 3 and 5. Next couple of days are going to be really interesting.
Regards, hasten
The "what" (price action) is more important than the "why" (news, earnings, and so on).
| Description: |
|
| Filesize: |
54.03 KB |
| Viewed: |
485 Time(s) |
|
|
|
| Back to top |
|
|
hasten
White Belt
Joined: 30 Jun 2011
Posts: 216
|
| Post: #54 Posted: Sun Jan 08, 2012 10:50 pm Post subject: NIFTY |
|
|
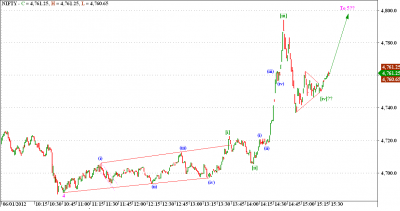
This is a 1 min chart of the advance towards the closing of the markets. We can observe a leading diagonal and then a sharp rise ion wave [iii] of 5. There seems to be a triangle formation taking place in wave [iv], though I have marked it as complete, it my extend sideways and take more time to complete. One last dash towards the 4815 - 4865 range is required to complete this pattern. The minimum requirement is to cross the high of wave {a}. Once this is done we may expect this zigzag pattern to be complete and then look for the original down trend to resume. But getting so deep into such lower time frames sometimes takes our focus off the larger picture!
Regards, hasten
Trade what you see, Not what you believe.
| Description: |
|
| Filesize: |
33.86 KB |
| Viewed: |
507 Time(s) |
|
|
|
| Back to top |
|
|
vinay28
Black Belt
Joined: 24 Dec 2010
Posts: 11748
|
| Post: #55 Posted: Mon Jan 09, 2012 8:37 am Post subject: |
|
|
"But getting so deep into such lower time frames sometimes takes our focus off the larger picture!
very well said, hasten!
|
|
| Back to top |
|
|
hasten
White Belt
Joined: 30 Jun 2011
Posts: 216
|
| Post: #56 Posted: Mon Jan 09, 2012 9:25 pm Post subject: DOLLER INDEX |
|
|
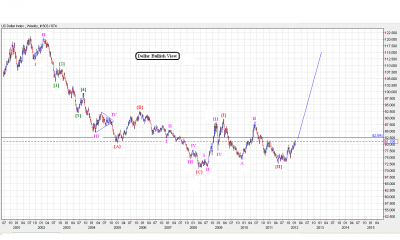
Dollar Index has multiple possibilities. One is a bullish, with a major bottom in place, as wave {I} and {II} seems to be complete. What is expected now is a dynamic advance in wave {III}. A rise in dollar is bearish for other asset classes and currencies (for us a very weak rupee ahead). But before we position ourselves for a stronger dollar lets examine alternate possibilities too.
Regards, hasten
Do not look back upon what has been done. Go ahead!
| Description: |
|
| Filesize: |
69.53 KB |
| Viewed: |
491 Time(s) |
|
|
|
| Back to top |
|
|
prasenjit
White Belt
Joined: 31 Dec 2010
Posts: 59
|
| Post: #57 Posted: Mon Jan 09, 2012 9:31 pm Post subject: |
|
|
| perfect analysis
|
|
| Back to top |
|
|
hasten
White Belt
Joined: 30 Jun 2011
Posts: 216
|
| Post: #58 Posted: Mon Jan 09, 2012 9:32 pm Post subject: DOLLER INDEX |
|
|
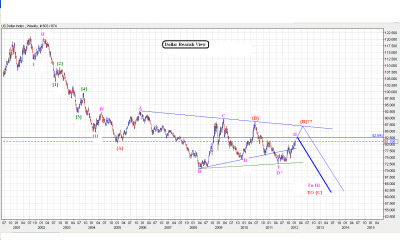
Dollar weekly chart, shows multiple possibilities! An alternate bearish view on dollar can be contemplated as shown in adjacent chart. we can see a clear impulsive downmove complete and followed by a triangle formation, either complete or just abut to be completed according to the second count on chart, in which we are still forming wave E. But if the triangle was completed earlier, then we had a 5 wave move down, and a corrective upmove which is perilously close to the 61.8% retracement level of wave I down. If we get resisted at 82.591 levels then we may fall in wave III which should be especially dynamic.
Now I have purposefully avoided putting a target on both the counts as this being a weekly chart we will get enough time to act once either of our count proves right and gives us confirmation.
But given the precarious economic conditions in US and EU, I feel our bullish count should be our preferred count, and the bearish possibility should be used to prepare a backup plan.
Regards, hasten
Take up one idea. Make that one idea your life - think of it, dream of it, live on that idea. Let the brain, muscles, nerves, every part of your body, be full of that idea, and just leave every other idea alone. This is the way to success.
| Description: |
|
| Filesize: |
71.11 KB |
| Viewed: |
450 Time(s) |
|
|
|
| Back to top |
|
|
hasten
White Belt
Joined: 30 Jun 2011
Posts: 216
|
| Post: #59 Posted: Mon Jan 09, 2012 9:40 pm Post subject: NIFTY |
|
|
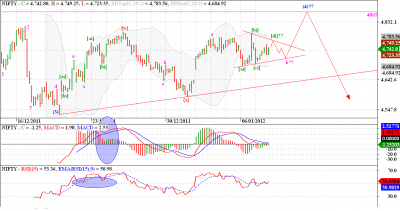
Nifty may be forming a triangle in wave b and might complete the wave (4) with a thrust from the triangle. The target seems to be around 4865. Our ending diagonal seems to be in contention still. Again unless and until we cross the 4865 levels confidently we are firm on our ending diagonal scenario.
Triangle are very good patterns to trade, so keep and eye when it is about to complete, late in tomorrows trading day!
Regards,hasten
Let us not depend upon the world for pleasure.
| Description: |
|
| Filesize: |
57.28 KB |
| Viewed: |
569 Time(s) |
|
|
|
| Back to top |
|
|
vinay28
Black Belt
Joined: 24 Dec 2010
Posts: 11748
|
| Post: #60 Posted: Mon Jan 09, 2012 9:47 pm Post subject: |
|
|
| hasten, according to you, how much nifty has to exceed 4865 for the next likely downturn to be negated?
|
|
| Back to top |
|
|
|
|
You cannot post new topics in this forum
You cannot reply to topics in this forum
You cannot edit your posts in this forum
You cannot delete your posts in this forum
You cannot vote in polls in this forum
You can attach files in this forum
You can download files in this forum
|
Powered by phpBB © 2001, 2005 phpBB Group
|
|
|


