|
|
| View previous topic :: View next topic |
| Author |
MY CHART (AND YOUR TOO.............) |
hasten
White Belt

Joined: 30 Jun 2011
Posts: 216
|
Post: #61  Posted: Tue Jan 10, 2012 10:21 am Post subject: Posted: Tue Jan 10, 2012 10:21 am Post subject: |
 |
|
hasten, according to you, how much nifty has to exceed 4865 for the next likely downturn to be negated?[/quote]
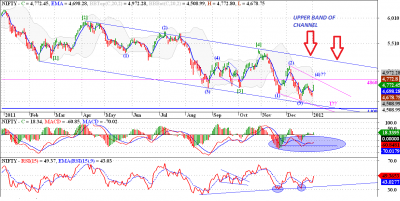
Lets come to deep if u look at daily chart the ending diagoanl scenario is still in contention we may be forming a zigzag in wave (4). and the target for wave (c) will be in the range of 4860 by the guideline of equlity (wave {a}==wave{C}]if we get resisted around 4860 levels on nifty,we may go down again in our previous target zone of 4500-4300levels ,and target zone is extended lower toll 4300 ,due to this new development in wave (4).
But there is an other rule and its says we need minimum 20% correction for confirmation of any leg , it means if nifty resistance from 4865 but fail to give correction more then 20 % of (4) wave, so it will beextend to another higher level , and as par my analysis next level will be upper band of channel .
Regards, hasten
Take up one idea. Make that one idea your life - think of it, dream of it, live on that idea. Let the brain, muscles, nerves, every part of your body, be full of that idea, and just leave every other idea alone. This is the way to success.[/u]
| Description: |
|
| Filesize: |
81.46 KB |
| Viewed: |
473 Time(s) |
|
Last edited by hasten on Wed Jan 25, 2012 10:35 pm; edited 2 times in total |
|
| Back to top |
|
 |
|
|  |
vinay28
Black Belt

Joined: 24 Dec 2010
Posts: 11748
|
Post: #62  Posted: Tue Jan 10, 2012 10:38 am Post subject: Posted: Tue Jan 10, 2012 10:38 am Post subject: |
 |
|
| many thanks hasten. so at least 100 points above 4865
|
|
| Back to top |
|
 |
apka
Black Belt

Joined: 13 Dec 2011
Posts: 6137
|
Post: #63  Posted: Tue Jan 10, 2012 11:08 am Post subject: hourly chart Posted: Tue Jan 10, 2012 11:08 am Post subject: hourly chart |
 |
|
hello hasten,
i really like your style of deep analysis of nifty. i have a chart here. it is the hourly chart of nifty from november 2010 top high till date. would like your comments on it.

http://i40.servimg.com/u/f40/16/90/40/23/110.png
I feel minimum 250 points upside should come without correction of more than 50 points at a time because after a long time this channel has broken.
|
|
| Back to top |
|
 |
nsinojia
Yellow Belt

Joined: 21 Dec 2009
Posts: 624
|
Post: #64  Posted: Tue Jan 10, 2012 5:11 pm Post subject: Posted: Tue Jan 10, 2012 5:11 pm Post subject: |
 |
|
 hasten ji namaskaar ... if 4933 ns taken out on eod basis target is 5227 ns hasten ji namaskaar ... if 4933 ns taken out on eod basis target is 5227 ns 
|
|
| Back to top |
|
 |
hasten
White Belt

Joined: 30 Jun 2011
Posts: 216
|
|
| Back to top |
|
 |
hasten
White Belt

Joined: 30 Jun 2011
Posts: 216
|
Post: #66  Posted: Tue Jan 10, 2012 6:56 pm Post subject: Posted: Tue Jan 10, 2012 6:56 pm Post subject: |
 |
|
| nsinojia wrote: |  hasten ji namaskaar ... if 4933 ns taken out on eod basis target is 5227 ns hasten ji namaskaar ... if 4933 ns taken out on eod basis target is 5227 ns  |
Nitin ji namasCAR ,kaise hai aap ? .............. if 4933 ns taken out on eod basis target is 5227 ns>>>>>> i agree  
|
|
| Back to top |
|
 |
apka
Black Belt

Joined: 13 Dec 2011
Posts: 6137
|
Post: #67  Posted: Tue Jan 10, 2012 7:30 pm Post subject: Re: hourly chart Posted: Tue Jan 10, 2012 7:30 pm Post subject: Re: hourly chart |
 |
|
hasten,
is your below chart daily or hourly? it's what amibroker gave me as result. which software do you use? i will check elsewhere also.
| hasten wrote: |
Sorry apka but you are drawing in wrong way , I also drawn trending since 9/11/10 to today(on daily chart) and it still not broken .if it brake 1000 points of rally also possible .(along with chat )
Regards, hasten
There is a way to do it better-- find it.
|
|
|
| Back to top |
|
 |
anand1234
Yellow Belt

Joined: 17 Jul 2010
Posts: 830
|
Post: #68  Posted: Tue Jan 10, 2012 8:22 pm Post subject: Posted: Tue Jan 10, 2012 8:22 pm Post subject: |
 |
|
| hasten wrote: | | nsinojia wrote: |  hasten ji namaskaar ... if 4933 ns taken out on eod basis target is 5227 ns hasten ji namaskaar ... if 4933 ns taken out on eod basis target is 5227 ns  |
Nitin ji namasCAR ,kaise hai aap ? .............. if 4933 ns taken out on eod basis target is 5227 ns>>>>>> i agree   |
hi....hasten
wt u think now ?.............NF closed just above ur res. fegure(4865)..................form here 4950 is poss??..........or ur previous tgt 4300??......pls comments
thanks
anand
]
|
|
| Back to top |
|
 |
hasten
White Belt

Joined: 30 Jun 2011
Posts: 216
|
Post: #69  Posted: Tue Jan 10, 2012 10:58 pm Post subject: Re: hourly chart Posted: Tue Jan 10, 2012 10:58 pm Post subject: Re: hourly chart |
 |
|
| apka wrote: | hasten,
is your below chart daily or hourly? it's what amibroker gave me as result. which software do you use? i will check elsewhere also.
| hasten wrote: |
Sorry apka but you are drawing in wrong way , I also drawn trending since 9/11/10 to today(on daily chart) and it still not broken .if it brake 1000 points of rally also possible .(along with chat )
Regards, hasten
There is a way to do it better-- find it.
|
|
Its daily chart ,and it is not because of charting software,if u draw in right way it will give the same result in any charting platforms.by the way its icharts JCharts (Premium) service .
Lets come to your chart, its seems like the first 2 point are not properly connected .don't try to connect all tops ,just connect first 2 points properly and extend the line simple .
Regards,hasten
You have to grow from the inside out. None can teach you, none can make you spiritual. There is no other teacher but your own soul.
|
|
| Back to top |
|
 |
hasten
White Belt

Joined: 30 Jun 2011
Posts: 216
|
Post: #70  Posted: Tue Jan 10, 2012 11:07 pm Post subject: Posted: Tue Jan 10, 2012 11:07 pm Post subject: |
 |
|
| anand1234 wrote: | | hasten wrote: | | nsinojia wrote: |  hasten ji namaskaar ... if 4933 ns taken out on eod basis target is 5227 ns hasten ji namaskaar ... if 4933 ns taken out on eod basis target is 5227 ns  |
Nitin ji namasCAR ,kaise hai aap ? .............. if 4933 ns taken out on eod basis target is 5227 ns>>>>>> i agree   |
hi....hasten
wt u think now ?.............NF closed just above ur res. fegure(4865)..................form here 4950 is poss??..........or ur previous tgt 4300??......pls comments
thanks
anand
] |
I have already answered the same question to vinay28.u need to scroll down and read todays post .
Regards,hasten
Technical analysis is a skill that improves with experience and study. Always be a student and keep learning.
|
|
| Back to top |
|
 |
hasten
White Belt

Joined: 30 Jun 2011
Posts: 216
|
Post: #71  Posted: Wed Jan 11, 2012 8:56 am Post subject: BANK NIFTY Posted: Wed Jan 11, 2012 8:56 am Post subject: BANK NIFTY |
 |
|
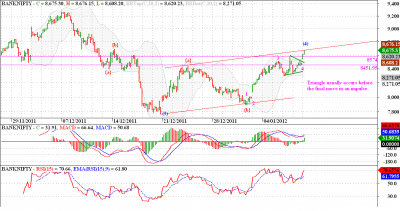
My view of Nifty getting resisted around 4865 - 80 levels is gaining in credibility, and the additional confidence comes from the chart of Banknifty. We can observe a triangle in wave 4 of Banknifty in the adjacent chart. Also RSI is nearing the OB zone, MACD is setting up nicely for a negative divergence on waves 3 and 5. So if all this happens then we are very close to seeing a top, at least short term one on Banknifty, and Nifty though is forming a different pattern will not diverge too much from Banknifty. I feel a surprising BAD result from a couple of major companies may spook the markets.
Regards, hasten
I strive to put in perfect trades again and again, every time, always.
| Description: |
|
| Filesize: |
59.83 KB |
| Viewed: |
483 Time(s) |
|
|
|
| Back to top |
|
 |
hasten
White Belt

Joined: 30 Jun 2011
Posts: 216
|
Post: #72  Posted: Wed Jan 11, 2012 9:09 am Post subject: NIFTY Posted: Wed Jan 11, 2012 9:09 am Post subject: NIFTY |
 |
|
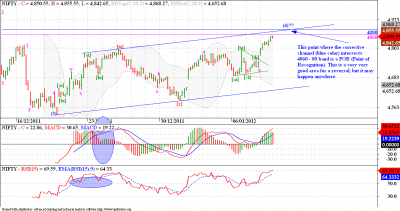
Nifty at a very critical juncture, if I look at Nifty through my analysis. In almost 10 years in markets I have learnt one thing, that you cannot take your knowledge very seriously. So if we just look at the chart of Nifty without any markings and drawings on it, it does not look much different.
So through my analysis, we can see we are just about to complete a zigzag correction and are very near the upper channel boundary. The range of 4860 - 4880 is very critical. If we break out from this level with a bang we will have to reconsider our count, else we are still within the boundaries of my count of wave (4) within an Ending Diagonal.
Reagards, hasten
Price is the ultimate indicator. Everything else is secondary.
| Description: |
|
| Filesize: |
52.75 KB |
| Viewed: |
534 Time(s) |
|
|
|
| Back to top |
|
 |
hasten
White Belt

Joined: 30 Jun 2011
Posts: 216
|
Post: #73  Posted: Wed Jan 11, 2012 7:04 pm Post subject: Infosys Posted: Wed Jan 11, 2012 7:04 pm Post subject: Infosys |
 |
|
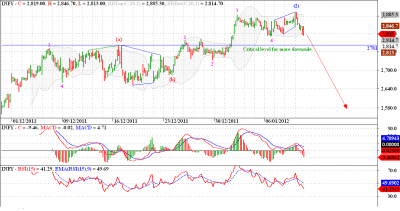
Infy results are going to be declared tomorrow. The EW formation seen on the charts suggests, that we have completed an important degree advance at these levels. Observe a big negative divergence on waves 3 and 5. 2781 hold the key, for big downside. Hope tomorrows results help achieve this price action.
Regards,hasten
If you don’t follow the stock market, you are missing some amazing drama.
| Description: |
|
| Filesize: |
55.21 KB |
| Viewed: |
466 Time(s) |
|
|
|
| Back to top |
|
 |
hasten
White Belt

Joined: 30 Jun 2011
Posts: 216
|
Post: #74  Posted: Wed Jan 11, 2012 7:09 pm Post subject: NIFTY Posted: Wed Jan 11, 2012 7:09 pm Post subject: NIFTY |
 |
|
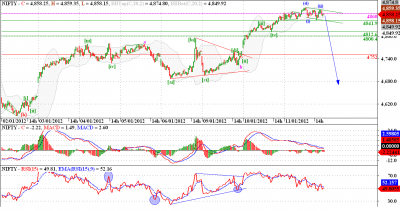
Nifty as per my analysis may have topped today, but only market action can confirm it. I have marked may levels on the chart, we took support at 4841 and bounced back sharply, we might have formed an irregular correction in wave (ii). and once the base channel in green color is broken down we might correct sharply, and embark on wave (5) down.
Regards,hasten
Good trading is not about being right,it is about trading right.If you want to be successful,you need to think of the long run and ignore the outcome of individual trades....
| Description: |
|
| Filesize: |
58.89 KB |
| Viewed: |
482 Time(s) |
|
|
|
| Back to top |
|
 |
prasenjit
White Belt

Joined: 31 Dec 2010
Posts: 59
|
Post: #75  Posted: Wed Jan 11, 2012 7:49 pm Post subject: Posted: Wed Jan 11, 2012 7:49 pm Post subject: |
 |
|
ur analysis is very very simply defined....keep it up..... 
|
|
| Back to top |
|
 |
|
|
You cannot post new topics in this forum
You cannot reply to topics in this forum
You cannot edit your posts in this forum
You cannot delete your posts in this forum
You cannot vote in polls in this forum
You can attach files in this forum
You can download files in this forum
|
Powered by phpBB © 2001, 2005 phpBB Group
|
|
|

