|
|
| View previous topic :: View next topic |
| Author |
MY CHART (AND YOUR TOO.............) |
hasten
White Belt

Joined: 30 Jun 2011
Posts: 216
|
Post: #91  Posted: Sat Jan 14, 2012 3:40 pm Post subject: Posted: Sat Jan 14, 2012 3:40 pm Post subject: |
 |
|
| rk_a2003 wrote: | In the long run there is only one winner in the market. Broker. I win he gets. You win he gets. I lose he gets. You lose he gets!!
Look at your contract you will be knowing State is charging you more than your broker in the form of the taxes on your trades and you have to pay IT again if you are a net gainer.So ammend it... The winners are the State and the Broker. |
You should to read "Broker zone 2 (book)" by "Routh shez" .
Regards, hasten
Market rewards students and punishes arrogants..
|
|
| Back to top |
|
 |
|
|  |
hasten
White Belt

Joined: 30 Jun 2011
Posts: 216
|
Post: #92  Posted: Sat Jan 14, 2012 3:54 pm Post subject: Posted: Sat Jan 14, 2012 3:54 pm Post subject: |
 |
|
| vinay28 wrote: | hasten, why are you limiting your timing to tomorrow only for the two levels you have given on up and downside? It can be day after also or day after that?
RK - why are you suddenly so philosophic?  |
After tomorrow there is infinity too...........market has infinite combinations.
and i can't catch all those combinations.
Regards, hasten
Easy to define entry .Very difficult to define exit.
Last edited by hasten on Sun Jan 15, 2012 9:00 pm; edited 2 times in total |
|
| Back to top |
|
 |
DH1988
White Belt

Joined: 15 May 2007
Posts: 135
|
Post: #93  Posted: Sat Jan 14, 2012 7:20 pm Post subject: Posted: Sat Jan 14, 2012 7:20 pm Post subject: |
 |
|
| DON...thx for gold.....
|
|
| Back to top |
|
 |
hasten
White Belt

Joined: 30 Jun 2011
Posts: 216
|
Post: #94  Posted: Sat Jan 14, 2012 10:00 pm Post subject: Posted: Sat Jan 14, 2012 10:00 pm Post subject: |
 |
|
| KatrinaaDP wrote: | | hasten wrote: | | KatrinaaDP wrote: | | hasten Sir, namaskar tell us any nifty positional trading charts patterns |
Sorry didn't get you what exactly want to know .if u want to know about nifty's positional view ,that is already posted.you just need to check my thread properly .
But if you want to know about any particular pattern to trade or strategies for positional nifty trading, than sorry to say ,i am not sharing any strategies here .i am just sharing my view and most of them based on ELLIOT WAVE . ( I will start some thread in strategies section soon too.......but allow me some time )
Regards, hasten
Market rewards students and punishes arrogants. |
hastensir thank you for ur rply we want to know insteaof intraday how to trade positional long term trade, educate us sir |
If u want my view on higher time frame(daily and weekly ) for position trading based on same concept elliott wave ( if i am not getting wrong ) than I will post some chart for you soon on higher time frame .( allow me some time please)
Regards, hasten
Get at top or bottom .Come out when its enough.
Last edited by hasten on Sun Jan 15, 2012 10:04 pm; edited 2 times in total |
|
| Back to top |
|
 |
KatrinaaDP
White Belt

Joined: 11 Sep 2010
Posts: 95
|
Post: #95  Posted: Sun Jan 15, 2012 11:04 am Post subject: Posted: Sun Jan 15, 2012 11:04 am Post subject: |
 |
|
| Thx sir we will wait
|
|
| Back to top |
|
 |
hasten
White Belt

Joined: 30 Jun 2011
Posts: 216
|
Post: #96  Posted: Sun Jan 15, 2012 9:01 pm Post subject: Posted: Sun Jan 15, 2012 9:01 pm Post subject: |
 |
|
| hasten wrote: | | vinay28 wrote: | hasten, why are you limiting your timing to tomorrow only for the two levels you have given on up and downside? It can be day after also or day after that?
RK - why are you suddenly so philosophic?  |
After tomorrow there is infinity too...........market has infinite combinations.
and i can't catch all those combinations.
Regards, hasten
Easy to define entry .Very difficult to define exit. |
Forgive me for my rambling answer . let me explain ,if you look
at the chart carefully that i have been posted below your comment ,
is intraday chart(10min) thats why i am limiting the time by saying "Tomorrow" because count valid for 1 or maximum for 2 days (2 days only in rare conditions). we cannot take a week or whole month view from intraday chart .
Regards, hasten
Every dream has a price
|
|
| Back to top |
|
 |
vinay28
Black Belt

Joined: 24 Dec 2010
Posts: 11748
|
Post: #97  Posted: Sun Jan 15, 2012 9:33 pm Post subject: Posted: Sun Jan 15, 2012 9:33 pm Post subject: |
 |
|
thanks hasten. I was talking about a few days only. Monday for low and Tuesday onwards for high. 
|
|
| Back to top |
|
 |
hasten
White Belt

Joined: 30 Jun 2011
Posts: 216
|
Post: #98  Posted: Sun Jan 15, 2012 9:47 pm Post subject: Posted: Sun Jan 15, 2012 9:47 pm Post subject: |
 |
|
| hasten wrote: | | KatrinaaDP wrote: | | hasten wrote: | | KatrinaaDP wrote: | | hasten Sir, namaskar tell us any nifty positional trading charts patterns |
Sorry didn't get you what exactly want to know .if u want to know about nifty's positional view ,that is already posted.you just need to check my thread properly .
But if you want to know about any particular pattern to trade or strategies for positional nifty trading, than sorry to say ,i am not sharing any strategies here .i am just sharing my view and most of them based on ELLIOT WAVE . ( I will start some thread in strategies section soon too.......but allow me some time )
Regards, hasten
Market rewards students and punishes arrogants. |
hastensir thank you for ur rply we want to know insteaof intraday how to trade positional long term trade, educate us sir |
If u want my view on higher time frame(daily and weekly ) for position trading based on same concept elliott wave ( if i am not getting wrong ) than I will post some chart for you soon on higher time frame .( allow me some time please)
Regards, hasten
Get at top or bottom .Come out when its enough. |
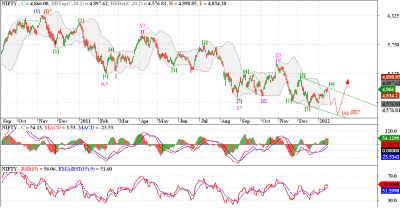
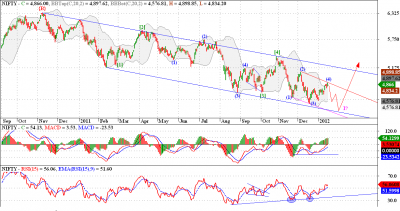
NIFTY DAILY COUNT:_ Count 1 and count 2
Regards, hasten
Don’t let the outcome of one trade alter your trading discipline. One trade doesn’t make a system..
| Description: |
|
| Filesize: |
63.86 KB |
| Viewed: |
404 Time(s) |
|
| Description: |
|
| Filesize: |
64.67 KB |
| Viewed: |
444 Time(s) |
|
|
|
| Back to top |
|
 |
hasten
White Belt

Joined: 30 Jun 2011
Posts: 216
|
Post: #99  Posted: Sun Jan 15, 2012 10:05 pm Post subject: Posted: Sun Jan 15, 2012 10:05 pm Post subject: |
 |
|
| hasten wrote: | | KatrinaaDP wrote: | | hasten wrote: | | KatrinaaDP wrote: | | hasten Sir, namaskar tell us any nifty positional trading charts patterns |
Sorry didn't get you what exactly want to know .if u want to know about nifty's positional view ,that is already posted.you just need to check my thread properly .
But if you want to know about any particular pattern to trade or strategies for positional nifty trading, than sorry to say ,i am not sharing any strategies here .i am just sharing my view and most of them based on ELLIOT WAVE . ( I will start some thread in strategies section soon too.......but allow me some time )
Regards, hasten
Market rewards students and punishes arrogants. |
hastensir thank you for ur rply we want to know insteaof intraday how to trade positional long term trade, educate us sir |
If u want my view on higher time frame(daily and weekly ) for position trading based on same concept elliott wave ( if i am not getting wrong ) than I will post some chart for you soon on higher time frame .( allow me some time please)
Regards, hasten
Get at top or bottom .Come out when its enough. |
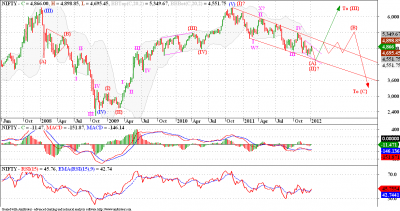
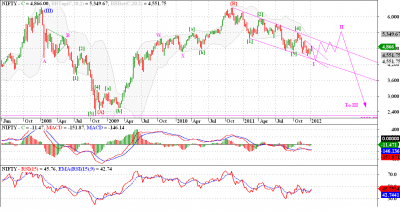
NIFTY WEEKLY COUNT :- COUNT 1 AND 2
Regards, hasten
Take up one idea. Make that one idea your life - think of it, dream of it, live on that idea. Let the brain, muscles, nerves, every part of your body, be full of that idea, and just leave every other idea alone. This is the way to success.
| Description: |
|
| Filesize: |
53.8 KB |
| Viewed: |
465 Time(s) |
|
| Description: |
|
| Filesize: |
59.92 KB |
| Viewed: |
426 Time(s) |
|
|
|
| Back to top |
|
 |
hasten
White Belt

Joined: 30 Jun 2011
Posts: 216
|
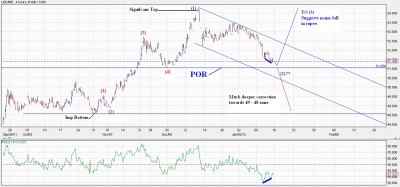
Post: #100  Posted: Mon Jan 16, 2012 9:34 am Post subject: USDINR near a short term POR! Posted: Mon Jan 16, 2012 9:34 am Post subject: USDINR near a short term POR! |
 |
|
USDINR is correcting after a sharp rise from the 43 - 44 levels right until 54 odd levels. The long tern count suggests that we might have completed a wave III advance at the point marked as "Significant Top" on the chart. Or as the wise men have warned against "calling an end to a 3rd wave advance", this might just be wave (1) of an extending wave [5] of III. All this might confuse the reader, but to put it simply, if USDINR takes support and starts rising from the levels of 51 - 50 we might see a protracted rally in the near future. But if we break the 51 - 50 level band then we might easily see the correction extending to 49 - 48 levels. All this of course will depend on how the Dollar behaves.
Regards, hasten
Easy to define entry .Very difficult to define exit.
| Description: |
|
| Filesize: |
204.98 KB |
| Viewed: |
399 Time(s) |
|
|
|
| Back to top |
|
 |
hasten
White Belt

Joined: 30 Jun 2011
Posts: 216
|
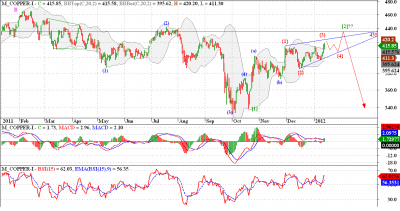
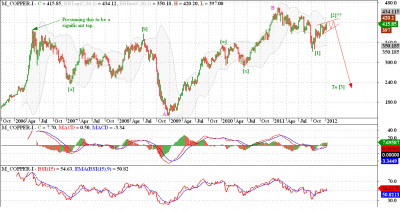
Post: #101  Posted: Mon Jan 16, 2012 9:35 am Post subject: Copper in a BIG Irregular Flat correction, since 2006! Posted: Mon Jan 16, 2012 9:35 am Post subject: Copper in a BIG Irregular Flat correction, since 2006! |
 |
|
I am presuming May 2006 top in copper as a significant top. The price action followed by the top is clearly corrective till date. We completed wave A in Dec 2008, and wave B in Jan 2011. Since then the price action is very confusing to say the least. But we can still count the fall as a five wave move. Thankfully no EWP rule is violated. Now following the wave (5) failure in [1] and retracing a zigzag in wave [2]. Wave (c) of [2] tracing out a possible ending diagonal. Once this pattern completes we will see wave [3] down, and that should be really dramatic.
Regards, hasten
They Say We Move The Markets, I Say I am Just Happy To Follow !!!!!
Market Is The Only Warfield Where You Will Surely Win Only If You Completely Surrender Yourself (to the flow)...
| Description: |
|
| Filesize: |
63.83 KB |
| Viewed: |
454 Time(s) |
|
| Description: |
|
| Filesize: |
62.19 KB |
| Viewed: |
422 Time(s) |
|
|
|
| Back to top |
|
 |
hasten
White Belt

Joined: 30 Jun 2011
Posts: 216
|
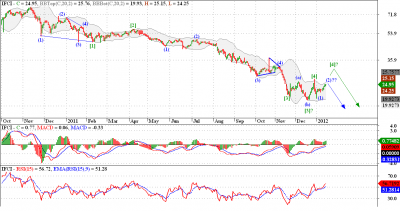
Post: #102  Posted: Mon Jan 16, 2012 9:39 am Post subject: IFCI one more low needed! Posted: Mon Jan 16, 2012 9:39 am Post subject: IFCI one more low needed! |
 |
|
IFCI is tanking for a long time now. But upon counting the waves since latest significant top we can see that IFCI has actually completed only 4 wave of the down move, to complete this down move we need another low in IFCI, and hopefully if Nifty falls from here we will get the same. A couple of possibilities are shown on chart.
Regards, hasten
You know my method. It is founded upon the observation of trifles. It is, of course, a trifle, but there is nothing so important as trifles.
| Description: |
|
| Filesize: |
56.39 KB |
| Viewed: |
430 Time(s) |
|
|
|
| Back to top |
|
 |
hasten
White Belt

Joined: 30 Jun 2011
Posts: 216
|
Post: #103  Posted: Mon Jan 16, 2012 11:18 pm Post subject: Hero Honda 'Irregular Flat' correction seems to be over! Posted: Mon Jan 16, 2012 11:18 pm Post subject: Hero Honda 'Irregular Flat' correction seems to be over! |
 |
|
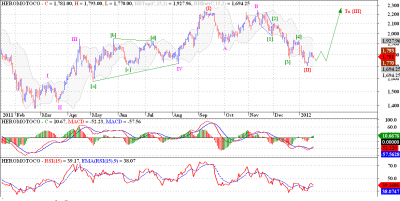
It seems that we prices have completed an important 5 wave advance in Sep 2001. Since then prices have traced out an irregular flat correction, in which wave C is 161.8 % of wave A. Also 5 waves seems to be complete in wave C of {II}. Now Hero Motors should go up from here in wave {III}. This is a beautiful chart.
Regards, hasten
I strive to put in perfect trades again and again, every time, always.
| Description: |
|
| Filesize: |
61.59 KB |
| Viewed: |
498 Time(s) |
|
|
|
| Back to top |
|
 |
hasten
White Belt

Joined: 30 Jun 2011
Posts: 216
|
Post: #104  Posted: Tue Jan 17, 2012 9:03 pm Post subject: Tata Steel zigzag is over,we are going up! Posted: Tue Jan 17, 2012 9:03 pm Post subject: Tata Steel zigzag is over,we are going up! |
 |
|
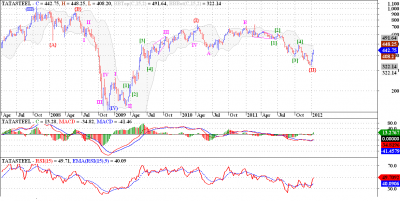
Tata Steel was consistently coming off from the top it made in April 2010, at the levels of 740 odd. It seems to have completed the mandatory 3 waves, a minimum requisite for a correction. Also this 3 wave move ended around the 61.8% correction of the upmove. We have witnessed a sharp 5 wave move up from the point marked {II} on the chart which where we are contemplating an end to the correction. So unless this is some different pattern we cannot see yet, we are headed up from here!
Regards, hasten
The best traders have developed an edge and most importantly, they trust their edge.
| Description: |
|
| Filesize: |
57.17 KB |
| Viewed: |
431 Time(s) |
|
|
|
| Back to top |
|
 |
hasten
White Belt

Joined: 30 Jun 2011
Posts: 216
|
Post: #105  Posted: Tue Jan 17, 2012 9:08 pm Post subject: Infosys Posted: Tue Jan 17, 2012 9:08 pm Post subject: Infosys |
 |
|
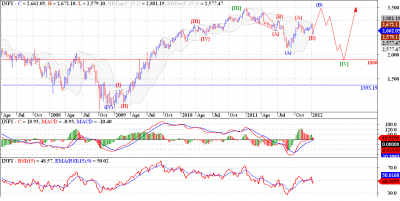
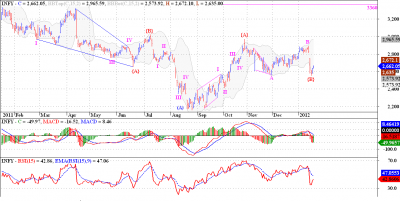
Infy posted bad results and corrected sharply as a reaction to the news. But can this be a classic opportunity to accumulate Infy for a rally close to all time highs if not above them. Well if EWP patterns are to be believed then we have a glimmer of hope that we might see the stalwart of D street back to its full glory, before the gory bear market takes its tall on it.
What I see on the charts is that from Jan - Aug 2011 we saw a 3 wave fall in wave (A) of an irregular flat correction. Then we have rallied 3 months close to 2970 levels. From this level we have completed a flat correction where wave C was effected by the bad guidance Infy posted for 2012. But looking at the chart we don't see how 2012 can be bad for Infy, if the recent lows around 2555 is protected then we may see a rally moving sharply up when markets are positive but with shallow corrections when the market is not doing too well. Is this really possible, well if we really believe what we see, then it is. But Bolton found it difficult to believe what he saw, then we cannot pressure ourselves too much, can we?
Regards, hasten
Price is the ultimate indicator. Everything else is secondary.
| Description: |
|
| Filesize: |
58.4 KB |
| Viewed: |
389 Time(s) |
|
| Description: |
|
| Filesize: |
59.98 KB |
| Viewed: |
360 Time(s) |
|
|
|
| Back to top |
|
 |
|
|
You cannot post new topics in this forum
You cannot reply to topics in this forum
You cannot edit your posts in this forum
You cannot delete your posts in this forum
You cannot vote in polls in this forum
You can attach files in this forum
You can download files in this forum
|
Powered by phpBB © 2001, 2005 phpBB Group
|
|
|

