| View previous topic :: View next topic |
| Author |
My Nifty Trades: 234 points in 2 days..using stochastic |
guru.july
White Belt

Joined: 13 Jul 2010
Posts: 82
|
Post: #1  Posted: Sun May 15, 2011 6:13 pm Post subject: My Nifty Trades: 234 points in 2 days..using stochastic Posted: Sun May 15, 2011 6:13 pm Post subject: My Nifty Trades: 234 points in 2 days..using stochastic |
 |
|
Hi,
I've been experimenting with stochastic on Nifty-1M. Here is the result of my trades for 12th and 13th May.
Regards,
Guru
| Description: |
|
| Filesize: |
127.72 KB |
| Viewed: |
1039 Time(s) |
|
|
|
| Back to top |
|
 |
|
|
|
maooliservice
White Belt
Joined: 04 Aug 2010
Posts: 93
|
| Post: #2 Posted: Sun May 15, 2011 7:23 pm Post subject: |
|
|
Dear sir,
what is the time frame for this
Thanks & Regards
Mohan
|
|
| Back to top |
|
|
guru.july
White Belt
Joined: 13 Jul 2010
Posts: 82
|
| Post: #3 Posted: Sun May 15, 2011 8:07 pm Post subject: |
|
|
| It's on 5min chart..
|
|
| Back to top |
|
|
amitkbaid1008
Yellow Belt

Joined: 04 Mar 2009
Posts: 540
|
| Post: #4 Posted: Sun May 15, 2011 8:45 pm Post subject: |
|
|
| Strategy is not very much clear. It will be better if you give details like What to look for first and how to make entry/exit.
|
|
| Back to top |
|
|
guru.july
White Belt
Joined: 13 Jul 2010
Posts: 82
|
| Post: #5 Posted: Sun May 15, 2011 9:59 pm Post subject: |
|
|
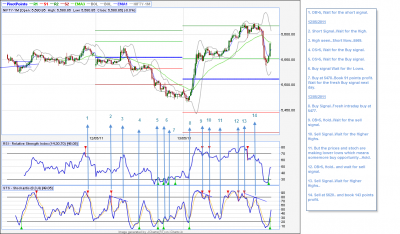
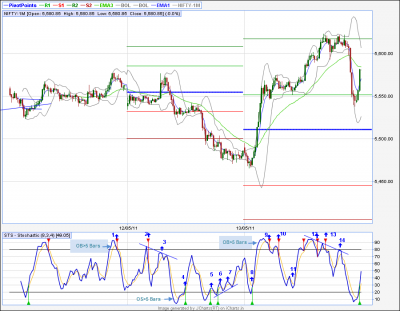
Okay once again explaining all the points.. Please refer to the chart..have made small correction.
Points:
1. OB>5 bars which means it still has some steam to go up.. at 3:10 on 11th May. Dont take any action.
12/05/2011
2. Next day on 12th May stoch gives a clear indication to short at 10:25. You can short here or wait for confirmation as stoch goes down and prices go up.
3. Point 3 gives clear indication to short as there is divergence and stoch prepares to go down and also the price. I shorted here at 5569.
4. Here stoch goes to Oversold zone (OS) and stays there for more than 5 bars. You can cover shorts by buying to make some profit or can wait.
5. Stoch again comes back to OS and stays there for > 5 bars.
6. Lower lows in price and \highs on stoch.. Ideal opportunity to book profits here.
7. I covered my shorts here at 5478.. Booked 91 points profit.
Stoch goes to neutral zone from OS zone.. which means if it comes back to hit OS zone next day it's an ideal opportunity to buy.
13/05/2011
8. As i told stoch comes and kisses the OS zone..and bough here at 5477.
9. Stoch goes to OB zone and stays there for more than 5 bars which means there is still steam.
10. You can book profit here at 5562 or take risk and wait for some more upper move which is what i did.. I took a risk here..anyway i'm on the profit side.
11. Price instead of higher highs is making a small correction which is also the case with the stoch.
12. Stoch goes back to OB zone and stays there for more than 5 bars.
13. Stoch goes back and kisses the OB zone and price is making higher highs. I sold here at 5620..143 points on the same day. ..
14. Stoch this time kisses the OB zone and it's an opportunity to short.. I dint take any trades at this time as i was happy with the profit...
Total profit 11,000/per lot in just two days..
Hope this explanation helps in understanding the strategy..
Regards,
Guru
| Description: |
|
| Filesize: |
85.41 KB |
| Viewed: |
813 Time(s) |
|
|
|
| Back to top |
|
|
BKMANJUNATH
White Belt
Joined: 29 Mar 2011
Posts: 4
|
| Post: #6 Posted: Mon May 16, 2011 6:54 pm Post subject: which stoch is better slow or fast for options? |
|
|
sir
iam doing option trading i am having puts of 5500 nifty which stochastic (slow or fast ) is better plz advice
|
|
| Back to top |
|
|
guru.july
White Belt
Joined: 13 Jul 2010
Posts: 82
|
| Post: #7 Posted: Mon May 16, 2011 7:44 pm Post subject: |
|
|
If you are using Jcharts(Premium) just use Stochastic (8, 3, 4) setting for intraday.
Regards,
Guru
|
|
| Back to top |
|
|
NS0420
White Belt
Joined: 20 Jan 2011
Posts: 32
|
| Post: #8 Posted: Tue May 17, 2011 11:14 am Post subject: |
|
|
| tf?
|
|
| Back to top |
|
|
guru.july
White Belt
Joined: 13 Jul 2010
Posts: 82
|
| Post: #9 Posted: Tue May 17, 2011 11:30 am Post subject: |
|
|
| 5 mins
|
|
| Back to top |
|
|
ssrivatsa
White Belt
Joined: 02 Sep 2009
Posts: 9
|
| Post: #10 Posted: Tue May 17, 2011 3:53 pm Post subject: |
|
|
Hi Guru
I too use Stoch-Price divergence. I would like to have a chat with you on the exit reading... let me know.
|
|
| Back to top |
|
|
vishal7072
White Belt
Joined: 13 Apr 2010
Posts: 4
|
| Post: #11 Posted: Tue May 17, 2011 4:00 pm Post subject: |
|
|
| sir, what is ob>5 bars and os>5 bars please explain
|
|
| Back to top |
|
|
guru.july
White Belt
Joined: 13 Jul 2010
Posts: 82
|
| Post: #12 Posted: Tue May 17, 2011 4:12 pm Post subject: |
|
|
Hi Srivatsa,
Fix up a time so that we can discuss on this topic. We cant exchange email id's here.. We'll chat on ichart itself.
Regards,
Guru
|
|
| Back to top |
|
|
guru.july
White Belt
Joined: 13 Jul 2010
Posts: 82
|
| Post: #13 Posted: Tue May 17, 2011 4:20 pm Post subject: |
|
|
Hi Vishal,
OB>5 means the stoch is in OB zone for more than 5 candlesticks of price. Please observe points 8 to 9 on the chart..From point 8 stoch is going to 80 after crossing 80 stoch is in OB zone (crossing 80 and coming back to 80 at point 9) and during this time the candlestick in price is more than 5 bars. You can count the bars.
Same logic applies to OS>5.
Please get back to me if you still dint understand same.
Regards,
Guru
|
|
| Back to top |
|
|
prabit
White Belt
Joined: 02 Jul 2009
Posts: 133
|
| Post: #14 Posted: Tue May 17, 2011 4:27 pm Post subject: |
|
|
Hi, Guru,
Excellent trading.Please keep posting your trades good or bad , we shall be able to learn from you.
Thanks
|
|
| Back to top |
|
|
vishal7072
White Belt
Joined: 13 Apr 2010
Posts: 4
|
| Post: #15 Posted: Tue May 17, 2011 4:30 pm Post subject: |
|
|
got it sir,
Thanks
I will definitely test the strategy
|
|
| Back to top |
|
|
|


