| View previous topic :: View next topic |
| Author |
My Stratergy of Swing Trading |
ManjunathG
White Belt

Joined: 07 Aug 2009
Posts: 32
|
Post: #1  Posted: Fri Feb 26, 2010 2:20 pm Post subject: My Stratergy of Swing Trading Posted: Fri Feb 26, 2010 2:20 pm Post subject: My Stratergy of Swing Trading |
 |
|
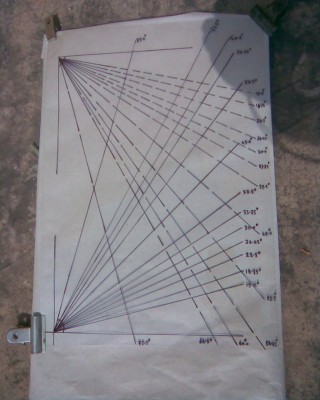
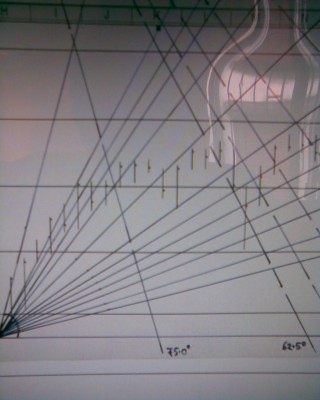
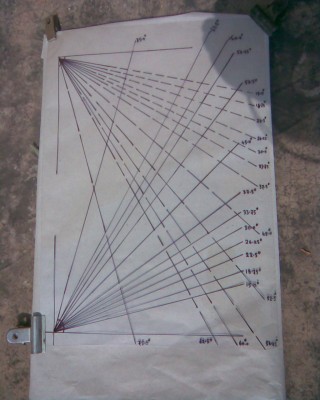
My Strategy of Swing Trading
| Description: |
|
| Filesize: |
251.76 KB |
| Viewed: |
645 Time(s) |
|
| Description: |
|
| Filesize: |
204.65 KB |
| Viewed: |
550 Time(s) |
|
| Description: |
|
| Filesize: |
237.23 KB |
| Viewed: |
555 Time(s) |
|
| Description: |
|
| Filesize: |
173.86 KB |
| Viewed: |
580 Time(s) |

|
| Description: |
|
| Filesize: |
251.76 KB |
| Viewed: |
566 Time(s) |
|
| Description: |
|
| Filesize: |
204.65 KB |
| Viewed: |
524 Time(s) |
|
| Description: |
|
| Filesize: |
237.23 KB |
| Viewed: |
516 Time(s) |
|
| Description: |
|

Download |
| Filename: |
MyStrategy.xls |
| Filesize: |
89.5 KB |
| Downloaded: |
954 Time(s) |
Last edited by ManjunathG on Fri Feb 26, 2010 3:10 pm; edited 1 time in total |
|
| Back to top |
|
 |
|
|
 |
ManjunathG
White Belt

Joined: 07 Aug 2009
Posts: 32
|
Post: #2  Posted: Fri Feb 26, 2010 2:22 pm Post subject: Posted: Fri Feb 26, 2010 2:22 pm Post subject: |
 |
|
hello guys , below i posted Basu sir's stgy. hope u like it
regards,
manjunath. gondkar
|
|
| Back to top |
|
 |
shekharinvest
Yellow Belt

Joined: 21 Dec 2007
Posts: 549
|
Post: #3  Posted: Fri Feb 26, 2010 4:37 pm Post subject: Posted: Fri Feb 26, 2010 4:37 pm Post subject: |
 |
|
ManjunathG
I must appreciate great efforts undertaken by you to put all the pieces of Basu's strategy together.
And I must also thank Basu for sharing his wonderful strategy with the fellow boarders and hope that he will continue to provide necessary inputs to fully comprehend the strategy.
ManjunathG you are requested to keep this thread alive and kicking.
SHEKHAR
|
|
| Back to top |
|
 |
arunjit.analyst
White Belt

Joined: 09 Nov 2009
Posts: 1
|
Post: #4  Posted: Fri Feb 26, 2010 9:06 pm Post subject: GREAT JOB DONE ! KUDOS TO BASU AND MANJUNATH Posted: Fri Feb 26, 2010 9:06 pm Post subject: GREAT JOB DONE ! KUDOS TO BASU AND MANJUNATH |
 |
|
Manjunath G,
I think i must admit being a part of this SB / icharts forum. I think i am blessed to have people like you and BASU with us.I ahve gone through the excel sheet. It's a sheer masterpiece... but the only thing that i think i am facing problem with is that i am unable to interpret everything about this strategy... I will be grateful if somebody helps me with the knowledge about the basics that i need to understand before understanding the strategy.
|
|
| Back to top |
|
 |
vinst
Black Belt

Joined: 09 Jan 2007
Posts: 3303
|
Post: #5  Posted: Sun Feb 28, 2010 4:26 pm Post subject: Posted: Sun Feb 28, 2010 4:26 pm Post subject: |
 |
|
Manjunath G,
thanks for posting the file. However I could not understand how to combine various indicators given in the file and arrive at ideal buy/sell points. Is it possible to provide explanation or sample buy/sell points with a scrip.
regards,
vin
|
|
| Back to top |
|
 |
rajanx12
White Belt

Joined: 25 Jan 2008
Posts: 18
|
Post: #6  Posted: Sun Feb 28, 2010 5:46 pm Post subject: Posted: Sun Feb 28, 2010 5:46 pm Post subject: |
 |
|
| ManjunathG wrote: | hello guys , below i posted Basu sir's stgy. hope u like it
regards,
manjunath. gondkar |
Hi
Tq for the information in nice way. Pl explain how the values of open/high/low/close and indicators MA, DMI are entered. Is it manual calculation and entry or XL prog.. itself calculates.
regards
raj
|
|
| Back to top |
|
 |
cbosein
White Belt

Joined: 02 Oct 2009
Posts: 39
|
Post: #7  Posted: Sun Feb 28, 2010 8:27 pm Post subject: Posted: Sun Feb 28, 2010 8:27 pm Post subject: |
 |
|
Hi Manjunath,
Thanks for posting such a useful post for swing trading.
Will you please post XLS file with formulas intact for us to enter EOD & Volume values on daily basis for our stocks. Xls file posted here was with values (formulas converted to values) which is not useful for our use.
Kindly post XLS file with formulas for our use.
Thanks in advance,
keerthi
|
|
| Back to top |
|
 |
vinst
Black Belt

Joined: 09 Jan 2007
Posts: 3303
|
Post: #8  Posted: Mon Mar 01, 2010 9:19 am Post subject: Posted: Mon Mar 01, 2010 9:19 am Post subject: |
 |
|
| cbosein wrote: | Hi Manjunath,
Thanks for posting such a useful post for swing trading.
Will you please post XLS file with formulas intact for us to enter EOD & Volume values on daily basis for our stocks. Xls file posted here was with values (formulas converted to values) which is not useful for our use.
Kindly post XLS file with formulas for our use.
Thanks in advance,
keerthi |
Keerthi,
All formulae are given in the formula sheet. In addition to indicators, what we also need to how basu is trading these combinations of indicators.
Did I miss some explanation of how to use them?
regards,
vin
|
|
| Back to top |
|
 |
ManjunathG
White Belt

Joined: 07 Aug 2009
Posts: 32
|
Post: #9  Posted: Mon Mar 01, 2010 10:44 am Post subject: Posted: Mon Mar 01, 2010 10:44 am Post subject: |
 |
|
hello guys, i request to basu sir , to post his new swing trade here, so it will be good for us to know the stgy in simple way.
regards 
manjunath
|
|
| Back to top |
|
 |
basu_6892
White Belt

Joined: 04 Apr 2007
Posts: 9
|
Post: #10  Posted: Mon Mar 01, 2010 12:00 pm Post subject: The Formulas in the Spreadsheet now has been reactivated. Posted: Mon Mar 01, 2010 12:00 pm Post subject: The Formulas in the Spreadsheet now has been reactivated. |
 |
|
On hurry I have forgot to re-activate the formulas in the Spreadsheet. The same now has been re-activated. You can identify the cell should you place the Mouse-Arrow Pointer on any chart. Execute the Left-click and now place the mouse pointer on any selected place - HIGH, LOW or other place. It will be automatically highlighted giving you the necessary information. It will help to identify the data from the Main Table.
Regarding other querries I will try to satisfy you with proper answer once I get the full picture from your querries. Please allow me till then.
Basu.
| Description: |
| Formulas have been re-activated for your reference purpose. |
|

Download |
| Filename: |
MyStrategy.xls |
| Filesize: |
88 KB |
| Downloaded: |
839 Time(s) |
|
|
| Back to top |
|
 |
cbosein
White Belt

Joined: 02 Oct 2009
Posts: 39
|
Post: #11  Posted: Mon Mar 01, 2010 12:49 pm Post subject: Posted: Mon Mar 01, 2010 12:49 pm Post subject: |
 |
|
Hi Mr.Basu,
Thanks a lot for your post with excel file with formulas activated. This will help us & minimise/eliminate human errors in typing/entering respective cells. Great help your end.
I want to prepare this excel file for Nifty futures swing trading strategy. Where or how to get (download link) every day's volume for Nifty futures. I am downloading *.csv file, EOD details of Nifty futures everyday but no column indicating volumes for that day.
Kindly indicate download link or how to get Volume from EOD details
Thanks & regards,
Keerthi
|
|
| Back to top |
|
 |
basu_6892
White Belt

Joined: 04 Apr 2007
Posts: 9
|
Post: #12  Posted: Mon Mar 01, 2010 6:19 pm Post subject: My Strategy in Swing trading. Posted: Mon Mar 01, 2010 6:19 pm Post subject: My Strategy in Swing trading. |
 |
|
Friends,
First I must express my indebtedness to Manjunath. Manju has helped me a lot in posting this Subject in the Forum. With this I find myself amongst my all the S/B Trader Collegues. I promise to contribute on the subject concern to the extend I have working experience. I am getting all the messages first and hope soon a picture will emerge on which we could open discussions. Thanks you all the participants.
I am once again thanking Manjunath for the pain he has taken in this regard.
Basu.
|
|
| Back to top |
|
 |
basu_6892
White Belt

Joined: 04 Apr 2007
Posts: 9
|
Post: #13  Posted: Mon Mar 01, 2010 9:54 pm Post subject: Collection of Necessary. Posted: Mon Mar 01, 2010 9:54 pm Post subject: Collection of Necessary. |
 |
|
The necessary Input which are required to update the Spreadsheet – like OPEN,HIGH,LOW,CLOSE and VOLUME (Trading Quantity) are obtained from the nseindia at the end of Trading Day. I have opened the “My Stock Watch” with the listed shares I require. You may find it at the bottom of the Home page of nseindia. The Menu Item “MyNSE” is at the bottom-left-side of the page. It will be wise to have your own “My Market Watch” opened with the LOGIN and PASSWORD generated there. Download your page from there to your Excell File. One can open “My Derivative Watch” there.
I copy down the Date from previous date, update it with today’s data, put the OHLC in proper places. I go to the WORKINGS area of the spreadsheet. After correcting the Date I put Volume in its proper place. The remaining cells are just copied down. So Your spreadsheet gets updated. Those who are interested to get data for Nifty Future, in addition to above the following path may be helpful : Open nseindia.com , at the top there is a Menu item F&O where all the necessary data is available.
Basu.
|
|
| Back to top |
|
 |
vinst
Black Belt

Joined: 09 Jan 2007
Posts: 3303
|
Post: #14  Posted: Tue Mar 02, 2010 4:47 pm Post subject: Posted: Tue Mar 02, 2010 4:47 pm Post subject: |
 |
|
Basu sir,
I went through the graphs given in the file where it became difficult to correlate the dates given by you in explanatory test with numbers on x-axis.
It is possible to make MS-excel plots with candles and indicators in the same graph. I am uploading file with 2 graphs modified. Please see the DMI chart on strategy page.
regards,
vin
| Description: |
|

Download |
| Filename: |
mystrategy_182.xls |
| Filesize: |
87 KB |
| Downloaded: |
678 Time(s) |
|
|
| Back to top |
|
 |
basu_6892
White Belt

Joined: 04 Apr 2007
Posts: 9
|
Post: #15  Posted: Tue Mar 02, 2010 5:42 pm Post subject: Types of Swings and the Ccyle of the Index/Stock. Posted: Tue Mar 02, 2010 5:42 pm Post subject: Types of Swings and the Ccyle of the Index/Stock. |
 |
|
By this time, all the participants might have downloaded the Excell File. Now let us start our discussions. Go to CELL A1 in ‘My Strategies’. Press F5 key and type in the Cell Address AE104, click the OK button. We are at Price-Moving Averages Chart.
From my working experiences in Trading, I found that there are two types of SWINGS : (a) Small Swings – Close price breaks the 8-D SMA from above but takes support of 34-EMA and retraces back, cross the 8-SMA from below and rises up till it turns down again to 8-SMA. This type of Swing is ideal for Day Trading. After a lot of study I found also that when Close price goes Up and down 8-D SMA the distance it travels is normally (±) 5%/6% from 8-D SMA. This Margin attracts the Day Traders. The percentage values can be obtained by the difference between Close price and Moving averages , =(Close price-8-SMA value)/8-D SMA value)*100, similary, applying the same formula, simply replacing 8-D SMA with the 34-EMAs.
(b) SWINGS - which crosses UP and DOWN both the 8-D SMA and 34-EMA and travels a distance (±) 11% to 9% from 34-D EMA. The second type of Swing is found suitable to the Swing Trader.
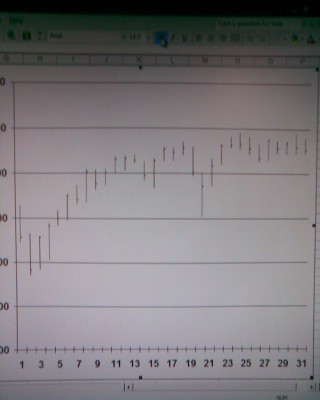
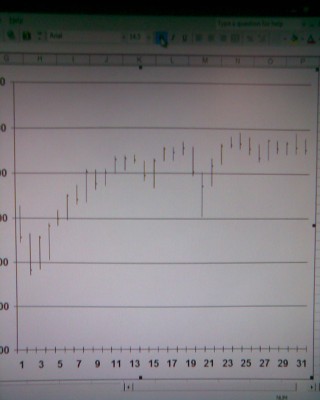
The next point that needs consideration is the Cycle of the Index/Stock selected for the Swing Trading. It can be said in a generalised way that on an Average a Cycle (Low-rising up-reached the Top-declining-again Low) consists of 19 to 23 days depending upon the Volumes traded. It may differs by 2 to 3 days in some circumstances. Naturally an Up Rally from Low-to-Top consists (19/2=9) or near about 8 to 9 days. From Top–to-again Low takes the same time. The Price Chart at the CELL Q78 in “My Strategy” shows 8-9 days. Just place the Mouse pointer at the white border, left click, now place the pointer on the Price Bars in the Chart. It shows BAR No.1 to 10 is the UPSWING. Bar No.11 to 18 is the DNSWING. Again, it can mentioned here that the duration of Swing depends upon the Investors’ Frenzy and volume traded. In next posing we shall discuss the Trading Method.
With regards,
Basu.
|
|
| Back to top |
|
 |
|

