| View previous topic :: View next topic |
| Author |
NATURAL GAS ANALYSIS |
mukundnikam
White Belt

Joined: 19 Dec 2014
Posts: 20
|
Post: #1  Posted: Sat Dec 12, 2015 11:41 am Post subject: NATURAL GAS ANALYSIS Posted: Sat Dec 12, 2015 11:41 am Post subject: NATURAL GAS ANALYSIS |
 |
|
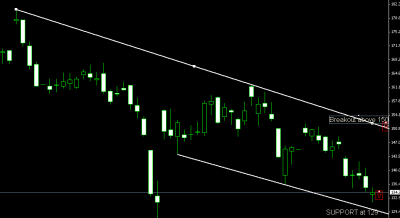
we are expecting NG target around 148 in 2 weeks with sl of 129
above 148 it will hit 200 in a month.
Thanks
Mukund Nikam
| Description: |
|
| Filesize: |
14.66 KB |
| Viewed: |
594 Time(s) |
|
|
|
| Back to top |
|
 |
|
|
|
AMBY
Yellow Belt

Joined: 05 Sep 2014
Posts: 503
|
| Post: #2 Posted: Sat Dec 12, 2015 11:56 am Post subject: |
|
|
| Thank you.
|
|
| Back to top |
|
|
amitagg
Black Belt

Joined: 01 Oct 2013
Posts: 4559
|
| Post: #3 Posted: Mon Dec 14, 2015 6:48 pm Post subject: |
|
|
124 next support
Should find a bottom between 112-124 in any case .... For positinal longs to enter
Cmp 126.5
|
|
| Back to top |
|
|
mukundnikam
White Belt
Joined: 19 Dec 2014
Posts: 20
|
| Post: #4 Posted: Mon Dec 14, 2015 6:56 pm Post subject: |
|
|
| THanks you Amit forinformations!
|
|
| Back to top |
|
|
rajmohanmbamhr
White Belt
Joined: 13 Oct 2011
Posts: 444
|
| Post: #5 Posted: Fri Dec 18, 2015 2:01 am Post subject: Commodities and Technical Analysis: |
|
|
Commodities and Technical Analysis
Last edited by rajmohanmbamhr on Fri Dec 18, 2015 2:06 am; edited 1 time in total |
|
| Back to top |
|
|
rajmohanmbamhr
White Belt
Joined: 13 Oct 2011
Posts: 444
|
| Post: #6 Posted: Fri Dec 18, 2015 2:04 am Post subject: Commodities and Technical Analysis: |
|
|
Commodities and Technical Analysis:
The prices of the commodities in MCX are quoted in INR. For all the securities the prices are determined by Demand and supply in the market. But for the commodity the prices are determined by Demand and supply and the dollar value against the rupee. But our charts in MCX are not discounting the dollar value against the rupee.so the technicals will not be perfect in MCX Commodity charts.
For example in 2012 NG had created(assumption) major support line at 120 or 2 dollar when the dollar value was 60. but the support line 120rs is equal to 1.82 dollar(1 dollar = 65 INR(Assumption)) and will not be the perfect support line today . So the majority of the technicals (Price action) will not be perfect in the commodity charts where the prices are determined by 2 factors.
So its better to use the charts which are denominated in US Dollar and take a position in MCX.
My intention is not critizing any concept. Just i shared what i thought in my mind.Your views are welcome.
|
|
| Back to top |
|
|
AMBY
Yellow Belt
Joined: 05 Sep 2014
Posts: 503
|
| Post: #7 Posted: Fri Dec 18, 2015 8:52 am Post subject: |
|
|
You clarify the most important point in commodities target , $/INR.
No one wants to take in to account currency depreciation,
I have notice Amitag pays attention to $ value in crude.
as crude has fallen so much how can N.F survive.
Than you.
|
|
| Back to top |
|
|
ninjadude
White Belt
Joined: 29 Jan 2013
Posts: 128
|
| Post: #8 Posted: Fri Jan 01, 2016 2:20 am Post subject: |
|
|
BELATED MERRY CHRISTMAS AND A HAPPY , PROSPEROUS NEW TRADING YEAR 2016 TO ALL THE TRADERS HERE

|
|
| Back to top |
|
|
mukundnikam
White Belt
Joined: 19 Dec 2014
Posts: 20
|
| Post: #9 Posted: Sat Jan 23, 2016 8:31 pm Post subject: NG in SUPPORT at 143 |
|
|
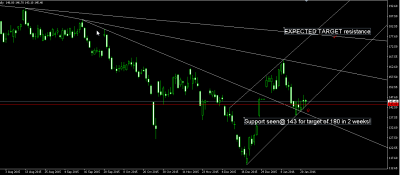
Team
Please find my daily basis analysis, and I feel that 143 is acting like great support which is estimating target of 180 in feb 2016. Please share your thoughts.
Thanks
Mukund
| Description: |
|
| Filesize: |
23.38 KB |
| Viewed: |
599 Time(s) |
|
|
|
| Back to top |
|
|
Allwell
White Belt
Joined: 24 Jan 2010
Posts: 183
|
| Post: #10 Posted: Sun Jan 24, 2016 5:50 pm Post subject: |
|
|
seems ok,
good work ... 
|
|
| Back to top |
|
|
AMBY
Yellow Belt
Joined: 05 Sep 2014
Posts: 503
|
| Post: #11 Posted: Mon Jan 25, 2016 9:05 am Post subject: |
|
|
| Thank You.
|
|
| Back to top |
|
|
mukundnikam
White Belt
Joined: 19 Dec 2014
Posts: 20
|
| Post: #12 Posted: Mon Jan 25, 2016 10:23 pm Post subject: Re: NG in SUPPORT at 143 |
|
|
Looks like pattern is failing for downside target, and not able to judge due to expiry as well. Pls share your thoughts.
| mukundnikam wrote: | Team
Please find my daily basis analysis, and I feel that 143 is acting like great support which is estimating target of 180 in feb 2016. Please share your thoughts.
Thanks
Mukund |
|
|
| Back to top |
|
|
mukundnikam
White Belt
Joined: 19 Dec 2014
Posts: 20
|
| Post: #13 Posted: Fri Jan 29, 2016 3:13 pm Post subject: NATURAL GAS ANALYSIS - Buy on DIPS |
|
|
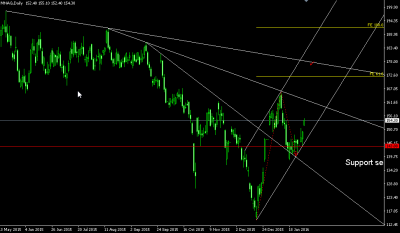
Team
please find the correct chart which seen yesterday. We can go long with sl of 143.80 for target of 180.
Share your views if you have any.
Thanks
Mukund
| Description: |
|
| Filesize: |
19.86 KB |
| Viewed: |
576 Time(s) |
|
|
|
| Back to top |
|
|
amitagg
Black Belt
Joined: 01 Oct 2013
Posts: 4559
|
| Post: #14 Posted: Fri Jan 29, 2016 6:15 pm Post subject: |
|
|
Yes looks like a ABC corrective up ..... And mirrors crude chart with a lag.... Hence can anticipate rally .... ( there are breakdown possibllities in such corrective price structures ) hence trendline lower should be watched carefully.
Detailed observation can be had only after proper chart study.
|
|
| Back to top |
|
|
AMBY
Yellow Belt
Joined: 05 Sep 2014
Posts: 503
|
| Post: #15 Posted: Tue Feb 02, 2016 7:41 pm Post subject: |
|
|
| Your guidance is required.
|
|
| Back to top |
|
|
|


