|
|
| View previous topic :: View next topic |
| Author |
Need Help On Indicators Ask Me |
t.chatterjee
White Belt

Joined: 07 May 2010
Posts: 66
|
Post: #16  Posted: Sun Aug 08, 2010 8:35 am Post subject: Posted: Sun Aug 08, 2010 8:35 am Post subject: |
 |
|
| dijyya wrote: | Hellow All,
Thanks for your reply,
1st thing I like to clear to all of you that I am not new to the Stock Market. I am investing/trading since 2001. So it is unfair to presume that I am not serious about my question. I think equity market is serious business. I just told you that I can hold the stock up to 10-15 years if it deliver 15-20% return P.A. So there is no problem for holding period, it means not that I always hold the all the stock for such a long period. Some of the stock given very good return but sometime trapped in Market. Bought the Times Guaranty @ 18 and sold @ 180, While bought Rel Media (erstwhile Adlabs) @ 1640/ and still holding (CMP 210).
My Most of Investment/Trading are on the base of advice given by broker, friends or some guts feelings. Just want to know the right strategy about buy/sell stock. Time frame is no bar. It can be 3 month- 6 month or 10 year. Have any technical indication theory for buy the stock or get out from it and protect the profit or minimize the loss.
Thanks once again
Regards |
sorry to know tht u bought at 1640 and still holding at 210!!!
u wanted to know abt strategy and indicators,
yes, there r good indicators and strategies. bt da prb is they r too many to depend, i think almost everyday new strategy and indicators r deriving in the market and market is eventually eliminating them as well. in fact strategy and usage of indicators r totally dependent on the trader,trader is not the dependent here, no strategy is full proof, there r loopholes,
as a consequence, if u advocate 4 a set up, i can always contradict it,bcoz my strategy should match my mental setup and risk appetite, the ppls who r like minded may appreciate it, bt others at the same time, may think its useless or even harmful, so the key is, read abt all the standard indicators and then try to predict moves through them,but tht too, in paper trade only, u can find abt them by searching google, i personally like the older indicators, as they r time tested, now the question is wht r the standard indicators? lets use some imaginations, why r we here? bcoz, we were thrilled by the basic eod chart of ichart front page, i think this is the 1st impression wht ichart made on us, now think from the administrators view, would he put any thing which may complicated the whole thing for his prospective clients??  ,no, he will do every thing possible to surprise the casual viewer to make him a memeber, (that was my case also ) so if we depend on the indicators listed in eod chart premium, we wont be very wrong, now our job is simple, we now just need to know abt those indicator, ( i learnt this way) ,no, he will do every thing possible to surprise the casual viewer to make him a memeber, (that was my case also ) so if we depend on the indicators listed in eod chart premium, we wont be very wrong, now our job is simple, we now just need to know abt those indicator, ( i learnt this way)
i can give u some hint by mentioning wht i use, i use ema and bollinger band to confirm sup/ resis, rsi to know if the scrip is over sold or over bought and volume to confirm the trend
and one last thing, u wrote time frame is not a factor, but im sorry to say in my view, this is the most important factor, bcoz the mentalities of scalper, swing trader and a long term investor can not be the same, while a scalper or day trader would try to profit from a each single move, the long term investor would hardly feel any thing abt the sudden volatility, so the time frame is the most vital thing of the whole trading game. plz don’t allow ur strategy to dictate ur time frame, on the contrary its ur time frame which will guide u what to do and what not,
I wrote all these out of my lil bit exp, u may differ from my view but I feel it this way, but if u think its of any use and u need any further help, plz ask me
Thanks for ur time
|
|
| Back to top |
|
 |
|
| |
shekharinvest
Yellow Belt

Joined: 21 Dec 2007
Posts: 549
|
| Post: #17 Posted: Sun Aug 08, 2010 9:29 am Post subject: |
|
|
| pradeepgolfer wrote: | shekhar
You have not answered dijya's question what is the best technical indication to buy or sell a stock?
A trader is someone who buys and sells stock -there are short term medium term and long term traders.You can call long term traders, investors. But investors also refer to technicals.
So your answer is not relevant to dijyya's question or this thread. |
I am not qualified to answer the question, yet I have raised the doubt on the stratgegy dijjya wish to follow.
And he himslef has admitted that he is carrying a position from 1640 which is now at 210 now. Which may further go down to say Rs. 21 as well in next few years ! (Presumption only)
Buy and hold for next 15 years can't be termed as investment when you are investing in stocks whatever Technical Indicator /indication one may use it runs a very high risk of loosing the capital. A regular review and timely action in needed to protect the capital and book profits if any.
So virtually there is no time frame called as 15 years.
SHEKHAR
|
|
| Back to top |
|
|
Allwell
White Belt
Joined: 24 Jan 2010
Posts: 183
|
| Post: #18 Posted: Sun Aug 08, 2010 9:31 am Post subject: |
|
|
Hellow All,
Thanks once again for your reply,
Actually I am searching technical indication because I am surprise market movement sometime. After the carnage in Jan-08, the blue chip stock like Tata Steel went up to all time high level of 930 in May-08 and then all of sudden it collapse to the level of 130-150 in 8-9 months. How can blue chip stock like TISCO fell down to 85% from the top in no time. Analyst always prefer the good fundamental company. Is any change of fundamental in such a short period ?
Similarly entire bull run of 2004-07 the Auto stock went no where. Every one write off Tata Motor after Jaguar deal. But it went up to 120 to almost 1000 level within the period of 9-12 Month in 2009-10. Is any change of fundamental in such a short period ?
That is why I am searching any technical indication of Market. I personally like to follow up 34 day EMA on EOD Basis. Though I am still learning, my experience is if it break either side the stock/NF-BNF will give you 5 to 7% return most of time. But problem is one will never found Top/Bottom in this strategy.
Thanks all of you for time. Keep writing your views
Regards
|
|
| Back to top |
|
|
Allwell
White Belt
Joined: 24 Jan 2010
Posts: 183
|
| Post: #19 Posted: Sun Aug 08, 2010 9:55 am Post subject: |
|
|
| shekharinvest wrote: | | pradeepgolfer wrote: | shekhar
You have not answered dijya's question what is the best technical indication to buy or sell a stock?
A trader is someone who buys and sells stock -there are short term medium term and long term traders.You can call long term traders, investors. But investors also refer to technicals.
So your answer is not relevant to dijyya's question or this thread. |
I am not qualified to answer the question, yet I have raised the doubt on the stratgegy dijjya wish to follow.
And he himslef has admitted that he is carrying a position from 1640 which is now at 210 now. Which may further go down to say Rs. 21 as well in next few years ! (Presumption only)
Buy and hold for next 15 years can't be termed as investment when you are investing in stocks whatever Technical Indicator /indication one may use it runs a very high risk of loosing the capital. A regular review and timely action in needed to protect the capital and book profits if any.
So virtually there is no time frame called as 15 years.
SHEKHAR |
Hellow Shekhar,
Yes it is true that I am holding Rel-Media from the level of 1640. I bought the same in the 1st week of Jan-08. Within a period of 20-25 days it almost down 50%. Up to that time I believe that investor should not book loss. One day his prise might be arrive. But life is all about learning. Now it is impossible to me to get out that particular stock, even I know It can further go to 21 or 2.10 level. I can only wish that Chhote Bhaiya found somewhere Sholey or Lagan and my prise will arrive.
But then after I never lost such a big amount and trade/invest with proper S/L.
Thanks for your post
|
|
| Back to top |
|
|
pradeepgolfer
White Belt
Joined: 16 Sep 2009
Posts: 212
|
| Post: #20 Posted: Sun Aug 08, 2010 11:26 am Post subject: |
|
|
dijjya
There are more than 100 indicators available.If you have to take each one ,understand how to use them,find out which one works for which stock or market and then paper trade you will spend 5 years minimum before you start making money.
It is good you now use a stop loss.If you would have used a stop loss earlier you would have made consistent profits. But by observing a chart and using a simple reasoning you can learn how to buy and sell immediately.I give one example of such reasonig below.Please go through it.Though I am using a weekly chart the reasoning is valid for any timeframe and any market.
Fudamental analysis decides what company to buy or sell;technical analysis decides when to buy or sell.Technical analysis need not be complicated.You have to observe and understand what the price movement is telling you.
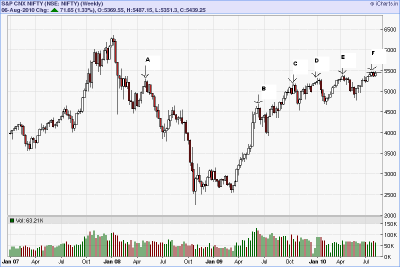
The chart is of NIFTY SPOT WEEKLY.
Notice first that the pivot marked A,5298.85,(5271, NF level) has been providing resistance to the nifty upmove, from October 2009 to present time.Once the NIFTY crossed the pivot high marked C,(5165 NF level) there was an immediate reaction down.Again, when NIFTY crossed the pivot marked D,(5303 NF level), there was a similar reaction which,however, made a higher low.THe Nifty again crossed the pivot high marked E,(5398,NF level) but this time, there was no reaction but a tight trading range, of 4 weeks, around the pivot point marked E, resulted.
Note this trading range has been above the weekly pivot A, for four weeks.This weekly pivot A, has provided resistance to the NIFTY for 9 months.
This is a fact,not an opinion or gut feel.This trading range is an abrupt departure from the behaviour of the NIFTY during the 9 months, preceding July.
I can only suggest two reasons for this happening.The sudden disappearance of downward reactions, suggests that the bears have withdrawn from the market and stopped the aggressive selling, evidenced earlier.THe second reason, is that the bulls have absorbed the agrresive selling, which has led to a trading range.The first reason suggests downward risk is limited to the extent of the trading range low.The second reason suggests that the bulls are in control and opens up the possibility of significant upside leading to an eventual test of all time high.
A retest of the 5349 level is technically possible, though the Dow recovery and closing well ofF the lows, makes it a very low probabilty event.But I cannot rule it out totally.
A clear break of the NIFTY SPOT LEVEL OF 5300 WILL SET UP A TEST OF THE 4700 LEVEL ON THE SPOT.
| Description: |
|
| Filesize: |
17.58 KB |
| Viewed: |
557 Time(s) |
|
|
|
| Back to top |
|
|
t.chatterjee
White Belt
Joined: 07 May 2010
Posts: 66
|
| Post: #21 Posted: Sun Aug 08, 2010 11:33 am Post subject: |
|
|
| dijyya wrote: | Hellow All,
Thanks once again for your reply,
Actually I am searching technical indication because I am surprise market movement sometime. After the carnage in Jan-08, the blue chip stock like Tata Steel went up to all time high level of 930 in May-08 and then all of sudden it collapse to the level of 130-150 in 8-9 months. How can blue chip stock like TISCO fell down to 85% from the top in no time. Analyst always prefer the good fundamental company. Is any change of fundamental in such a short period ?
Similarly entire bull run of 2004-07 the Auto stock went no where. Every one write off Tata Motor after Jaguar deal. But it went up to 120 to almost 1000 level within the period of 9-12 Month in 2009-10. Is any change of fundamental in such a short period ?
That is why I am searching any technical indication of Market. I personally like to follow up 34 day EMA on EOD Basis. Though I am still learning, my experience is if it break either side the stock/NF-BNF will give you 5 to 7% return most of time. But problem is one will never found Top/Bottom in this strategy.
Thanks all of you for time. Keep writing your views
Regards |
what all u wrote is simply fundamental in nature,
1. tata steel: its a metal stock, all the metal stocks, specially steel sector has shown some good up move before bejing Olympic due to huge demand in chaina. needless to say, chaina, the world's manufacturing hub, is the biggest consumer of metal and other industrial raw materials, but then what happened? china faced slowdown, asset bubble situation was there, there was a risk that china would bring down import and even some of the biggest manufacturing units were planning to bid goodbye due to slow down and currency evaluation, so all the metal stocks including tata steel faced serious challenge and were going down.
nowadays a level of ease is in air, so we can see some upmove, but that too, its monsoon,all the construction activities are almost at a halt, so really good move may be seen not before than October-November, tata steel, being the biggest supplier of this segment, was hurt most. for me tata steel is always otherwise fundamentally strong company, and i wud like to buy it in every decline with specific target in mind.
2. auto stock
the swift recovery in auto stocks including tata motors is a case of global demand along with strong demand in the region.
after the slowdown and bust phase , all the sectors r recovering and now a days the demand is high enough, so the auto sector, not only in india but all over the world,hv seen some good upmove,
off-course, i must say here, its very easy to write the reason after things have already taken place, but to predict on news is tougher one, so the rule for, i dont know really which news market will discount immediately and on which news the market will react sharply,(in ur example of tata motors, the jaguar case was discounted by the market and the scrip joined the rally),so i will rather wait to see what the market does after coming of a specific news and take step accordingly,
i cant ignore the market movement when i hv invested my hard earned cash, but then im not supposed to panic also, its a continuous process, no hard and fast approach can be taken here,
u may differ but for me its always so many news so little time situation, so i would rather depend on the greatest indicator ever made,THE PRICE, I WOULD ALWAYS WAIT TO SEE HOW THE MARKET REACTS ON A NEWS
thank for ur time
tushar
|
|
| Back to top |
|
|
pradeepgolfer
White Belt
Joined: 16 Sep 2009
Posts: 212
|
| Post: #22 Posted: Sun Aug 08, 2010 11:48 am Post subject: swing trading video |
|
|
dijjya
See this swing trading video by market wizard Linda Rachke
There are no indicators used.Only technical observation
http://www.cciclub.com/marketvu/linda-raschke-swing-trading.html
Use of simple things like averages help to make price movements clear. But any other indicator diverts your attention from what is happening in price.
Learn to observe and understand what the market is telling you.The market will always make it's intention clear, before moving.Even the moving averages say diffrent things in a trending market or a trading range.A break of a moving average is not always an indication to sell.In a strong trend, a break of a ma, is a buying opportunity.
Understand that a trend exists in some time frame:if not in 1 min chart it may be in a 2 min chart or a 3 min chart or a 4 min chart...and so on.
I personally do not refer to charts of less than 5 min.This because the profit is too low and I do not scalp
A stop loss should be put below the low which if broken suggests a change of trend.
Last edited by pradeepgolfer on Sun Aug 08, 2010 12:22 pm; edited 1 time in total |
|
| Back to top |
|
|
gomsi02
White Belt
Joined: 11 Feb 2010
Posts: 34
|
| Post: #23 Posted: Sun Aug 08, 2010 11:57 am Post subject: |
|
|
| pradeepgolfer wrote: | gomsi
You have said it yourself the best technical indicator is the least technical indicator.
In my view the best technical indicator is none.
However this thread is started to help calrify doubts and answer specific questions.Dijya's question says technical indication NOT technical indicator.
Please understand this thread is not to start a debate it is to help people with specific doubts
The best technical indication and also the most simple one, is to see if the stock is making higher highs and higher lows. |
Now we should be logical about terms. Least & none are not same. If it is none what is the use of discussion ?? Whether technical indiacator not associated with technical indiaction? U should understand that any posting welcomes individual view to continue the discussion. Did you not understand that in my entire posting I tried to clear all confusion about complicated indiactors and suggested of using only four indiactors ADX,EMA,MACD,RSI? People are already agreed with me.......and try to accept any opinion in positive attitude if not criticise logically.
|
|
| Back to top |
|
|
pradeepgolfer
White Belt
Joined: 16 Sep 2009
Posts: 212
|
| Post: #24 Posted: Sun Aug 08, 2010 12:21 pm Post subject: |
|
|
gomsi
A higher high and a higher low in a chart is a technical indication not A TECHNICAL INDICATOR
Is that logical enough for you?
Please try to read and understand what I am saying-there are hundreds of techniques without use of indicators.
I suggest you see the video by Linda Rachke who is known as market wizard throughout the world.I have posted the link-have you seen it? You are the one not being positive.
|
|
| Back to top |
|
|
gomsi02
White Belt
Joined: 11 Feb 2010
Posts: 34
|
| Post: #25 Posted: Sun Aug 08, 2010 1:08 pm Post subject: |
|
|
| pradeepgolfer wrote: | gomsi
A higher high and a higher low in a chart is a technical indication not A TECHNICAL INDICATOR
Is that logical enough for you?
Please try to read and understand what I am saying-there are hundreds of techniques without use of indicators.
I suggest you see the video by Linda Rachke who is known as market wizard throughout the world.I have posted the link-have you seen it? You are the one not being positive. |
U are cofused as U started the thread with technical indicator and later shifted to elsewhere? My friend making higher high and higher low is a technical chart pattern which is uptrend. Many a times merely seeing the chart U can feel whether it is uptrend, Down or side ways. Candle stick pattern like HAMMER,HM,Hc are strong bullish pattern. Ascending, descending, symmetrical triangle ,penants,gap,rectangle are strong continution pattern.Whether all those are technical indiaction or chart pattern? Have U seen the spring action in ascending triangle before flying high?? Any stock before flying high generates lot of static energy just like if you bend a spring from normal...I will discuss later on
|
|
| Back to top |
|
|
SwingTrader
Site Admin
Joined: 11 Aug 2006
Posts: 2903
Location: Hyderabad, India
|
| Post: #26 Posted: Sun Aug 08, 2010 2:06 pm Post subject: |
|
|
Mr. Pradeep,
It would greatly help if you concentrate on teaching what little bit you know about trading/investing. You yourself have admitted that you don't like to use indicators and then you start a thread asking users to post questions on technical indicators? To top it all you go off on a tangent and talk something totally different that is not related in anyway to technical indicators.
You have totally littered the forum with 10-12 topics and you are updating all the topics everyday. It looks like you have no focus.
Just stick to one thread in technical analysis section and just post your ideas there so people can find it. At the moment you have successfully confused even us, leave alone fresh/new traders who are trying to learn something.
Cool down and start posting your core ideas in a single topic. This is, I hope, good advise, take it.
_________________
Srikanth Kurdukar
@SwingTrader |
|
| Back to top |
|
|
pradeepgolfer
White Belt
Joined: 16 Sep 2009
Posts: 212
|
| Post: #27 Posted: Sun Aug 08, 2010 4:36 pm Post subject: |
|
|
Respected Sir
Sorry for the litter but the latest threads have broader subjects,I will not need to 'litter' any more hopefully.
The intention is to help people and dijjya's question was on 'technical indication' and not on any specific indicator.
That was the reason for the deviation.
It is not easy to put 15 years of experience into words but the market has already told me the same thing as you that I know very little about technical analysis.
I am grateful for your company because earlier I could not pay the exorbitant rates your competitors were demanding for intraday charts and it is because of your company that I can do intraday trading.
I hope you are successful because my trading depends only on your company.
Thank you
|
|
| Back to top |
|
|
tripathi_manu
White Belt
Joined: 27 Dec 2008
Posts: 62
|
| Post: #28 Posted: Tue Aug 10, 2010 1:07 am Post subject: Re: NEED HELP ON INDICATORS ASK ME |
|
|
| pradeepgolfer wrote: | | NEED HELP ON INDICATORS ASK ME post your questions here |
hi pradeep ji did not see u in last long time. thanks for the material u posted about hidden ( reverse) divergence long time back. it helped me academically.
regards.
manu tripathi
mantri.
PS I am not trading these days, being occupied with some other activities.
will catch u later.
|
|
| Back to top |
|
|
|
|
You cannot post new topics in this forum
You cannot reply to topics in this forum
You cannot edit your posts in this forum
You cannot delete your posts in this forum
You cannot vote in polls in this forum
You can attach files in this forum
You can download files in this forum
|
Powered by phpBB © 2001, 2005 phpBB Group
|
|
|


