| View previous topic :: View next topic |
| Author |
Need Help On Indicators Ask Me |
pradeepgolfer
White Belt

Joined: 16 Sep 2009
Posts: 212
|
Post: #1  Posted: Sat Aug 07, 2010 7:10 am Post subject: NEED HELP ON INDICATORS ASK ME Posted: Sat Aug 07, 2010 7:10 am Post subject: NEED HELP ON INDICATORS ASK ME |
 |
|
| NEED HELP ON INDICATORS ASK ME post your questions here
|
|
| Back to top |
|
 |
|
|
|
acharyams
Yellow Belt

Joined: 04 Jul 2010
Posts: 552
|
| Post: #2 Posted: Sat Aug 07, 2010 7:46 am Post subject: Re: NEED HELP ON INDICATORS ASK ME |
|
|
| what are the best eod indicators for next day intraday jobbing?
|
|
| Back to top |
|
|
pradeepgolfer
White Belt
Joined: 16 Sep 2009
Posts: 212
|
| Post: #3 Posted: Sat Aug 07, 2010 8:48 am Post subject: |
|
|
acharyams
In my 15 years of trading the only style of trading, I have not done is jobbing.
Sorry i am not qualifed to answer that
Last edited by pradeepgolfer on Sat Aug 07, 2010 9:00 am; edited 1 time in total |
|
| Back to top |
|
|
Allwell
White Belt
Joined: 24 Jan 2010
Posts: 183
|
| Post: #4 Posted: Sat Aug 07, 2010 8:58 am Post subject: |
|
|
Dear Pradeep
I like to buy some stock. What is the best technical indication to buy or sell stock ?
Regards
(dijyya)
|
|
| Back to top |
|
|
pradeepgolfer
White Belt
Joined: 16 Sep 2009
Posts: 212
|
| Post: #5 Posted: Sat Aug 07, 2010 9:47 am Post subject: |
|
|
dijyya
1). you have to decide for what period of time you want to keep it for.For a short peroid (1day to 15days) medium (3-6 months) long term (2-10 years)
This important because a stock may give a buy siganl on a 60 min chart and a neutral signal on 20 min chart and a sell signal on 5 min chart.
In this particular case it is an opportunity to buy when there is evidence of bottoming out on the 5 min chart.
2)You also have to decide whether to buy in cash or futures.
You answer these questions then we can take this matter further
|
|
| Back to top |
|
|
Allwell
White Belt
Joined: 24 Jan 2010
Posts: 183
|
| Post: #6 Posted: Sat Aug 07, 2010 9:52 am Post subject: |
|
|
| I can hold the stock 10-15 Years, if it can give appropriate return
|
|
| Back to top |
|
|
shekharinvest
Yellow Belt
Joined: 21 Dec 2007
Posts: 549
|
| Post: #7 Posted: Sat Aug 07, 2010 10:45 am Post subject: |
|
|
| dijyya wrote: | | I can hold the stock 10-15 Years, if it can give appropriate return |
Dijyya,
Sorry, but you don't seems to be a trader or serious about your question.
For that kind of investment buy a good MF or you can simply buy Niftybees.
No fundamental issues there.
SHEKHAR
|
|
| Back to top |
|
|
pradeepgolfer
White Belt
Joined: 16 Sep 2009
Posts: 212
|
| Post: #8 Posted: Sat Aug 07, 2010 12:46 pm Post subject: |
|
|
shekhar
You have not answered dijya's question what is the best technical indication to buy or sell a stock?
A trader is someone who buys and sells stock -there are short term medium term and long term traders.You can call long term traders, investors. But investors also refer to technicals.
So your answer is not relevant to dijyya's question or this thread.
|
|
| Back to top |
|
|
pradeepgolfer
White Belt
Joined: 16 Sep 2009
Posts: 212
|
| Post: #9 Posted: Sat Aug 07, 2010 3:00 pm Post subject: |
|
|
dijyya
There is no "best technical indication" and it may not be necessary to locate one.But one indication is to see how well the company has been doing for the last ten years, at least.
ITC has been the leader and doing well for 20 years-there is no reason to suppose, that it will not do well, for another ten.There are many companies-Reliance group,Bharthi telecom, Maruti Tisco-you can find that have done extremely well for last 15 years.That may be one simple indication.
Tendulkar has been doing well for the last 20 years.Two years back everybody said Tendulkar was finished.Recently Tendulkar was the first to make a double century in ODIs
What is top class will remain top class-What is 2nd class may become 3rd class.
To see other technical indications, you need to see a chart and for your holding time frame, you should follow a monthly chart.This will show you how the price has moved over many years.What you are looking for is a reasonably consistent uptrend, to buy.If there are steep falls, see how fast the stock recovered.This will show you, if there are eager buyers who are waitng to buy, on big declines, throughout its history.Notice how steep the graph is.If it is too steep, the price rise may not be sustainable. See if the stock is trending-meaning you can see it going up-or it's up movement is choppy. Observe the consolidations as it goes up.Are they small or wide-non volatile or volatile.Try to see at least a 100 monthly charts so you will get an idea of how many different types of price movements are experienced by stocks.All companies will behave differently but a company stock will behave in much the same way,over the years, in terms of its fluctuations and volatility.
For that kind of holding time frame it is necessary to buy in cash and take delivery.For a beginner and your question indicates you are a novice-correct me if I am wrong-the best way to get to know the stock market is to hold delivery and keep an eye on the stock market.It will take a mininmum of 5 years, to get an idea, of how markets move and behave.
And finally as the famous trader,Jessee Livermore said "The money is not in the thinking, it is in the waiting"
|
|
| Back to top |
|
|
peace69
White Belt
Joined: 27 Aug 2009
Posts: 113
|
| Post: #10 Posted: Sat Aug 07, 2010 8:05 pm Post subject: |
|
|
| hi pradeep. i'm not convinced to opinion 'What is top class will remain top class-What is 2nd class may become 3rd class'. there r nos of scripts which counted bluest blue chip co in their time & gone to BIFR. Hindustan Motors, Premier Auto, Baroda Rayon, Metal Box r some of such examples. these cos counted as evergreen cos in their time. where r these currently? people gives example of Infosys & says if only holded they would be millionair. but there was no taker of infosys on issue. even FA needs to use TA for proper & right time entry for maximise return. according to me one should invest in more then one cos with dividing his capital. cause all the cos not becomes infosys, reliance, lt. after investing, should keep eye on co. performance. is co. progressing or declining? if declining, why? what's liability & cash surplus? PE, EPS, GER r above sector avg or below? should dump non performing scripts & keep best performing scripts. best performing scripts also needs to lessen at some times & investing that ammount in new growing cos. mind it all these applys to long term (more then 5 years) investment. my opinion is FA also needs & should refer TA for avoiding wrong time entry. foe ex. how much return ril has given from jan-2008 to now? if v consider one has bought half at Jan high & half at Oct low, it's still quting below avg price. so wether FA or TA, investment or trading, all need to c TA. just my view. may be differ. no hard feelings. comment/counter comment welcome. regards.
|
|
| Back to top |
|
|
Allwell
White Belt
Joined: 24 Jan 2010
Posts: 183
|
| Post: #11 Posted: Sat Aug 07, 2010 8:32 pm Post subject: |
|
|
Hellow All,
Thanks for your reply,
1st thing I like to clear to all of you that I am not new to the Stock Market. I am investing/trading since 2001. So it is unfair to presume that I am not serious about my question. I think equity market is serious business. I just told you that I can hold the stock up to 10-15 years if it deliver 15-20% return P.A. So there is no problem for holding period, it means not that I always hold the all the stock for such a long period. Some of the stock given very good return but sometime trapped in Market. Bought the Times Guaranty @ 18 and sold @ 180, While bought Rel Media (erstwhile Adlabs) @ 1640/ and still holding (CMP 210).
My Most of Investment/Trading are on the base of advice given by broker, friends or some guts feelings. Just want to know the right strategy about buy/sell stock. Time frame is no bar. It can be 3 month- 6 month or 10 year. Have any technical indication theory for buy the stock or get out from it and protect the profit or minimize the loss.
Thanks once again
Regards
|
|
| Back to top |
|
|
manu_5123454
White Belt
Joined: 22 Oct 2009
Posts: 91
|
| Post: #12 Posted: Sun Aug 08, 2010 12:17 am Post subject: |
|
|
before searching any indicators u have to gain some basic knowledge about such indicator . according to me , 1st u have to decide which period u r looking for
like--- day trading,shortterm( 1months), mid term( 3-6moths), long term(1-4 years).
for the long term---- MA (moving avg.) ( double or tipple crossover)--it is very useful in trending market or impulse wave pattern but not in zigzag pattern. Like nifty is trading in trending market right now . 1st see weekly chart for buy/sell signal then go forward to daily chart , if weekly chart shows buy and daily chart shows sell then u have to wait for conformation in the weekly chart for sell signal .
mid term ----MA also with for any divergence indicators( RSI,MACD VOLUME etc, )
short term--- Use renko chart ( it is very easy to make money in volatile market )
day trading-----don't look which is the best . look which is suitable for u it depends upon own indicator or own price line strategy like some body says that --buy or sell depends upon the after breakout or breakdown of previous high or low.
if u r thinking longer term --- should have basic knowledge in EW ( elliott wave theory ). most of the people believe in this theory why i am advising u because at this time every big investors or traders tell buy buy buy buy buy. its right , they know fundamentally & technically so not worried about the any downfall ( 1000 point in nifty)but in this case u will be worried.
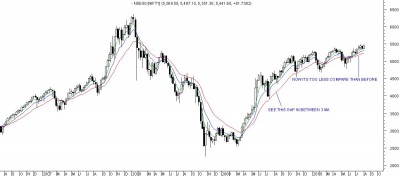
if u r asking me about view in nifty---- i think it should come down atleast 4000-3500 levels then may go upward min. 7000-8000 levels in 4-5 years. . i am not prepare for buying at this levels. in 4000 -3500 levels i will buy ---suzlon,relpower,ster,tatasteel,BOI,dlf,ivrclinfra, etc.
how do u prepare ----very easy method i have that follow the value research ( motilaloswal,sharekhan) for fundamental then go for technical according to own research not others.
type technical analysis in stock market in Google.com
| Description: |
|
| Filesize: |
70.71 KB |
| Viewed: |
634 Time(s) |
|
|
|
| Back to top |
|
|
gomsi02
White Belt
Joined: 11 Feb 2010
Posts: 34
|
| Post: #13 Posted: Sun Aug 08, 2010 1:04 am Post subject: |
|
|
The best technical indiactor is the least technical indicator. We can get importance in ADX as its movement from 15 towards 40 will indicate trend market and contrary choppy side ways once it comedown from 40 towards 20. In trend market MACD & EMA are good indicator where as in tradingmarket/sideways Stochastics(F & S) ,RSI are strong indicator to correct enter and enjoy maximum profit at the cost of small stop loss.Once ADX is towards 40 and +DI moves over -DI it is a strong buy signal. It is like driving a car whose front vision are candlestick pattern and rear mirror are ADX,RSI,EMA .I think only these indicators are sufficient for successfull trading with strong money management and psychology.Neither one require to watch 5 year in market to get the idea,nor it is required to be doctorate in technical theory for successfull trading. I feel swing trading is the best opportunity provider which been executed from one pivot to another. It is better than day trader or long term investor.
Last edited by gomsi02 on Sun Aug 08, 2010 1:45 am; edited 1 time in total |
|
| Back to top |
|
|
SID2060
White Belt
Joined: 04 Nov 2009
Posts: 319
|
| Post: #14 Posted: Sun Aug 08, 2010 1:17 am Post subject: |
|
|
| gomsi02 wrote: | | The best technical indiactor is the least technical indicator. We can get importance in ADX as its movement from 15 towards 40 will indicate trend market and contrary choppy side ways once it comedown from 40 towards 20. In trend market MACD & EMA are good indicator where as in tradingmarket/sideways Stochastics(F & S) ,RSI are strong indicator to correct enter and enjoy maximum profit at the cost of small stop loss.Once ADX is towards 40 and +DI moves over -DI it is a strong buy signal. It is like driving a car whose front mirror are candlestick pattern and rear mirror are ADX,RSI,EMA .I think only these indicators are sufficient for successfull trading with strong money management and psychology.Neither one require to watch 5 year in market to get the idea,nor it is required to be doctorate in technical theory for successfull trading. I feel swing trading is the best opportunity provider which been executed from one pivot to another. It is better than day trader or long term investor. |
Gomsi vry well said. I completely agree with u. May i have ur email address . We may share our views on the stock mkt via it. Mine is rockstar@hotmail.co.in
U may search me on facebuk using above email address. It would be great if we both stay in touch.
Sid
|
|
| Back to top |
|
|
pradeepgolfer
White Belt
Joined: 16 Sep 2009
Posts: 212
|
| Post: #15 Posted: Sun Aug 08, 2010 8:08 am Post subject: |
|
|
gomsi
You have said it yourself the best technical indicator is the least technical indicator.
In my view the best technical indicator is none.
However this thread is started to help calrify doubts and answer specific questions.Dijya's question says technical indication NOT technical indicator.
Please understand this thread is not to start a debate it is to help people with specific doubts
The best technical indication and also the most simple one, is to see if the stock is making higher highs and higher lows.
|
|
| Back to top |
|
|
|


