| View previous topic :: View next topic |
| Author |
Nifty analysis - Welgro corner |
welgro
Brown Belt

Joined: 24 Sep 2012
Posts: 1784
|
Post: #271  Posted: Sun Jul 20, 2014 5:52 pm Post subject: Posted: Sun Jul 20, 2014 5:52 pm Post subject: |
 |
|
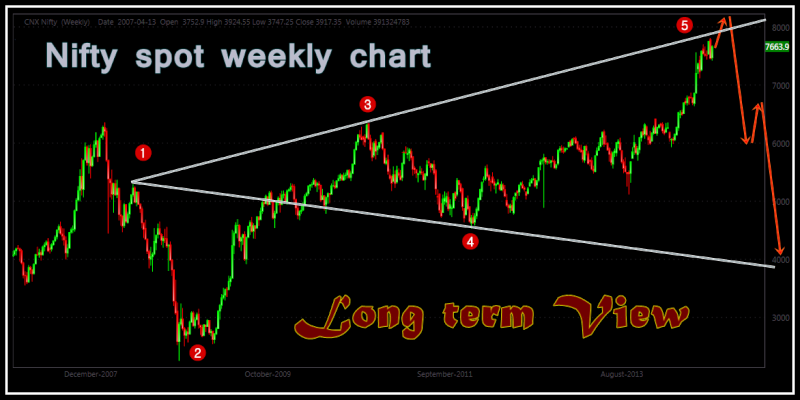
Nifty spot if hold above 7700 level then we expected some good upside rally.
Last week candle pattern is Piercing Line (Trend reversal pattern)
So nifty spot if breach 7700, positional traders can take long positions with 7580 stop loss.
Expected targets are 7900 and 8050 level.[Maximum we expected 8500 levels in this bull run]
Note: nifty spot entered risk zone when the nifty spot once if breach the 8000 mark. (The extension line of point 1 and 3 is also 8K level.) |
|
| Back to top |
|
 |
|
|
|
welgro
Brown Belt
Joined: 24 Sep 2012
Posts: 1784
|
| Post: #272 Posted: Mon Jul 21, 2014 9:47 am Post subject: |
|
|
 |
|
| Back to top |
|
|
welgro
Brown Belt
Joined: 24 Sep 2012
Posts: 1784
|
| Post: #273 Posted: Mon Jul 21, 2014 1:25 pm Post subject: |
|
|
| welgro wrote: | | welgro wrote: | 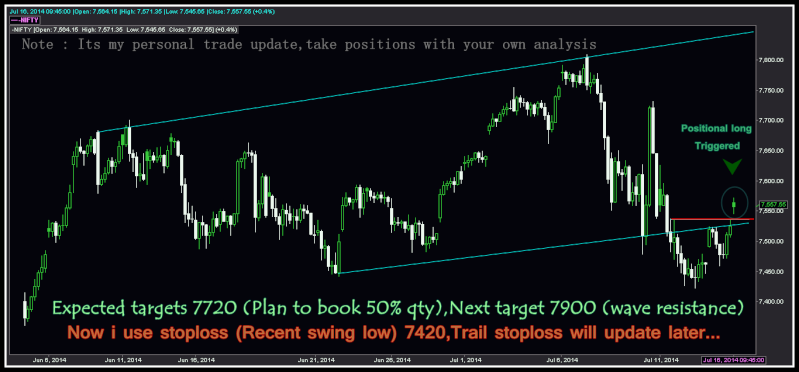 |
Nifty spot once breach 7625,Plan to book 50% qty (BOF) |
booked 25% Qty long at 7710 level.Now balance 25% qty holding. |
|
| Back to top |
|
|
welgro
Brown Belt
Joined: 24 Sep 2012
Posts: 1784
|
| Post: #274 Posted: Mon Jul 21, 2014 7:02 pm Post subject: |
|
|
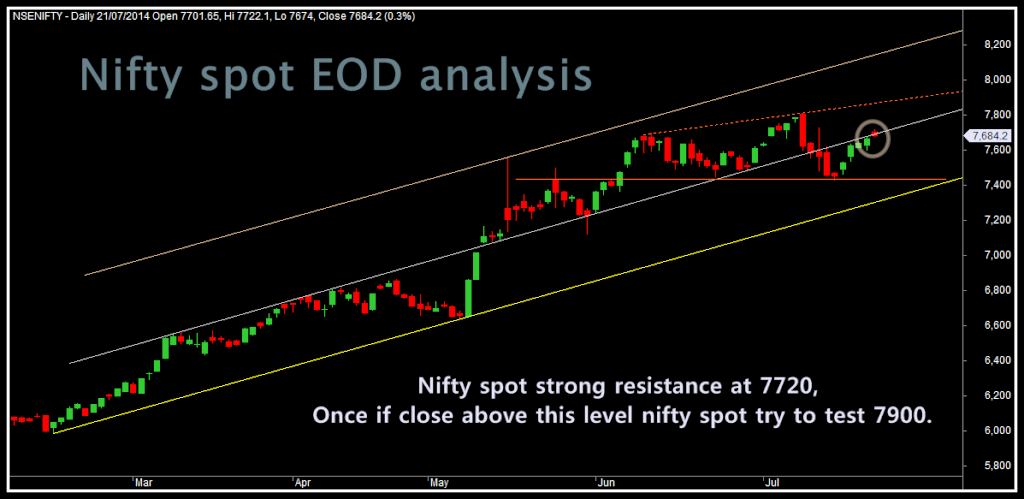
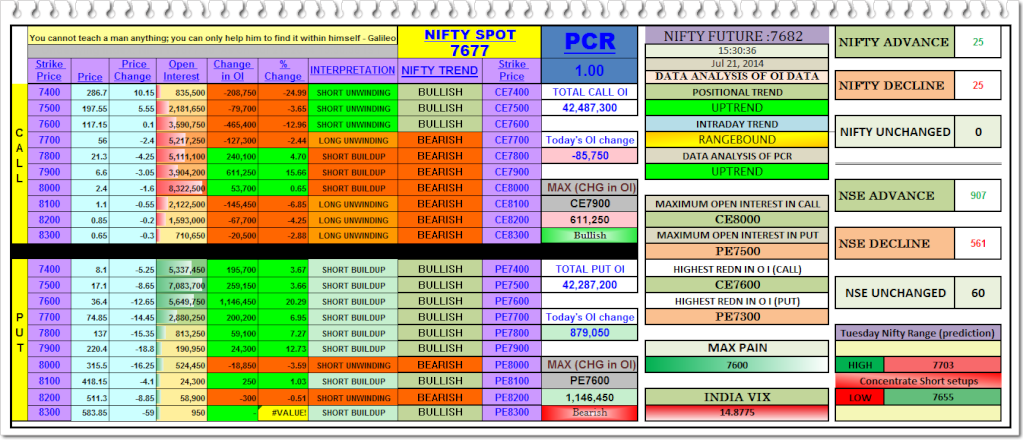
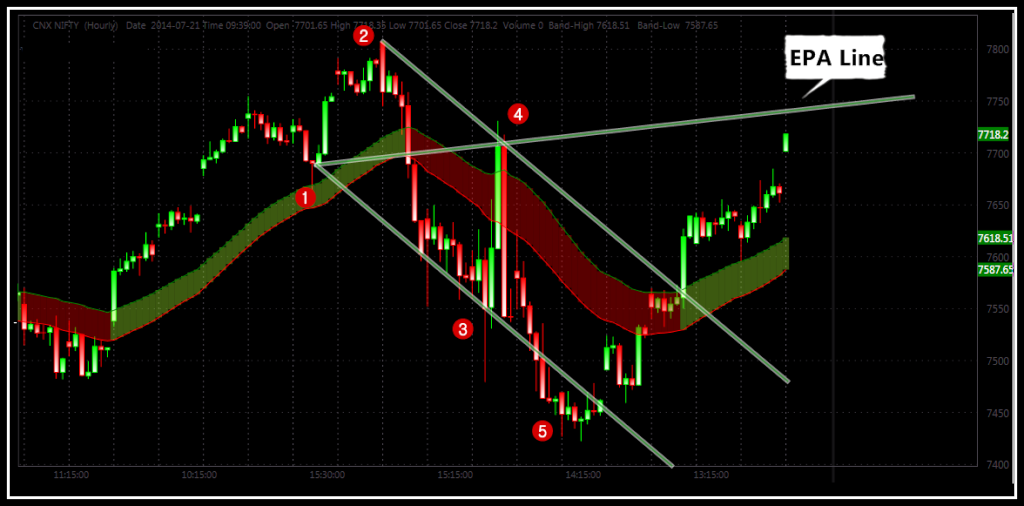
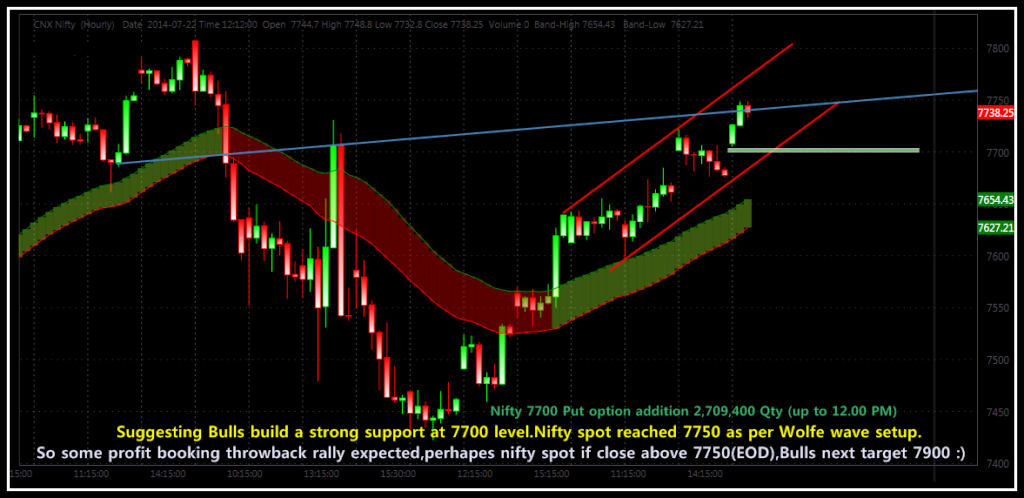
Already we expected short covering rally will continue till 7720 level.
Today nifty spot reached 7720 then made high 7722.10.
Nifty pullback rally is almost 300 points compare with recent swing low 7422.
Nifty spot opened with good gap (Above the key resistance trend line), positional long holders used this gap up open for booking their longs. How to we catch this scenario? Today nifty First hour candle is Exhaustion gap.
So what about the next move in nifty?
Nifty spot will face strong resistance at 7720 level (Exhaustion gap).Once if close (EOD) above this level then we may see some fresh bull rally. Today 7600 PE OI added 22.9 K suggesting strong support at 7600 level. Nifty spot if hold above 7630 bulls will manage their prior trend. Perhaps Nifty spot close (Hourly) below 7630 then 7600PE short sellers are start to covering their shorts. Yes... If happens nifty positional trend will change to bearish mode.[img][/img] |
|
| Back to top |
|
|
welgro
Brown Belt
Joined: 24 Sep 2012
Posts: 1784
|
| Post: #275 Posted: Tue Jul 22, 2014 9:55 am Post subject: |
|
|

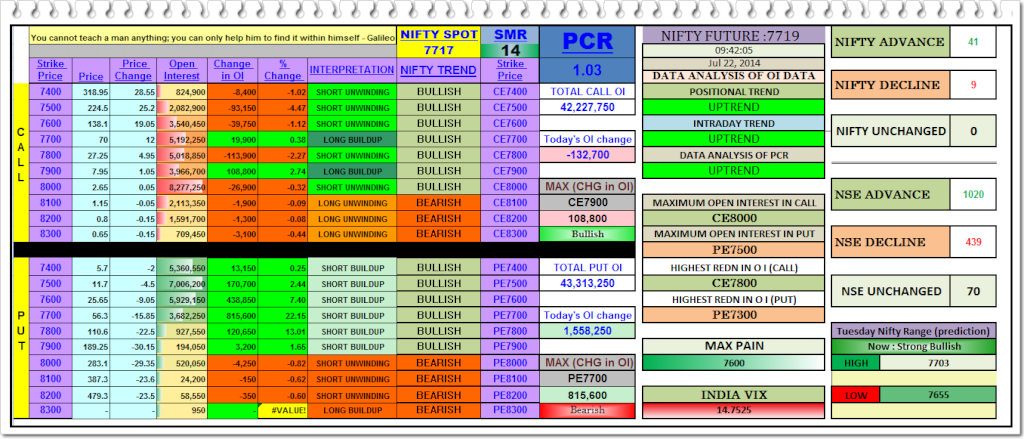
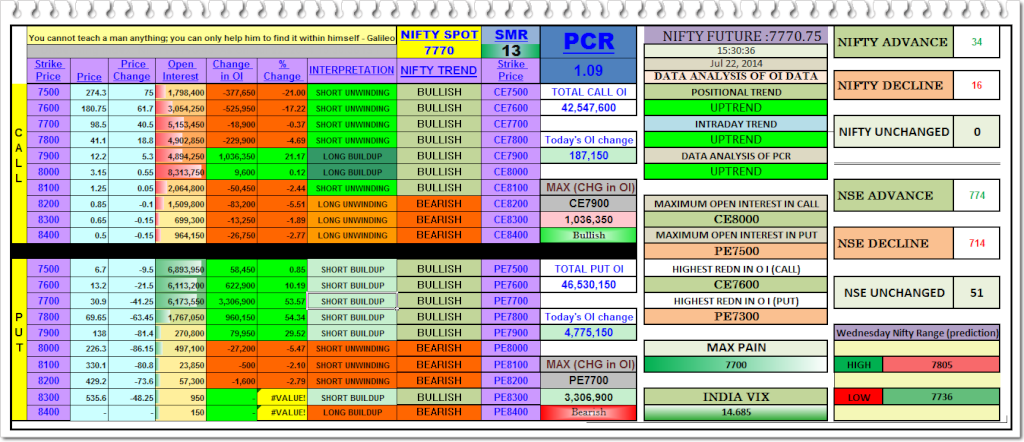
SMR Ratio is otherwise known as smart money ratio indicator
SMR = India VIX / PCR
SMR = Smart Money Ratio
India Vix = Volatility Index based on nifty option contracts
PCR = Near month Put Call Ratio based on OI
How to read SMR
SMR is a measure of fear in the market. A value of less than 12 indicates that market is lack of fear and volatility and the higher PCR ratio(greater than 1) supports such kind of action. And a value of 20 or greater indicates too much of fear in the market which is highly motivated with lower PCR ratio (less than 1). It is a kind of indicator which provides information about which kind of market we are right now. |
|
| Back to top |
|
|
welgro
Brown Belt
Joined: 24 Sep 2012
Posts: 1784
|
| Post: #276 Posted: Tue Jul 22, 2014 12:26 pm Post subject: |
|
|
 |
|
| Back to top |
|
|
welgro
Brown Belt
Joined: 24 Sep 2012
Posts: 1784
|
| Post: #277 Posted: Tue Jul 22, 2014 2:49 pm Post subject: |
|
|
 |
|
| Back to top |
|
|
welgro
Brown Belt
Joined: 24 Sep 2012
Posts: 1784
|
| Post: #278 Posted: Tue Jul 22, 2014 3:39 pm Post subject: |
|
|
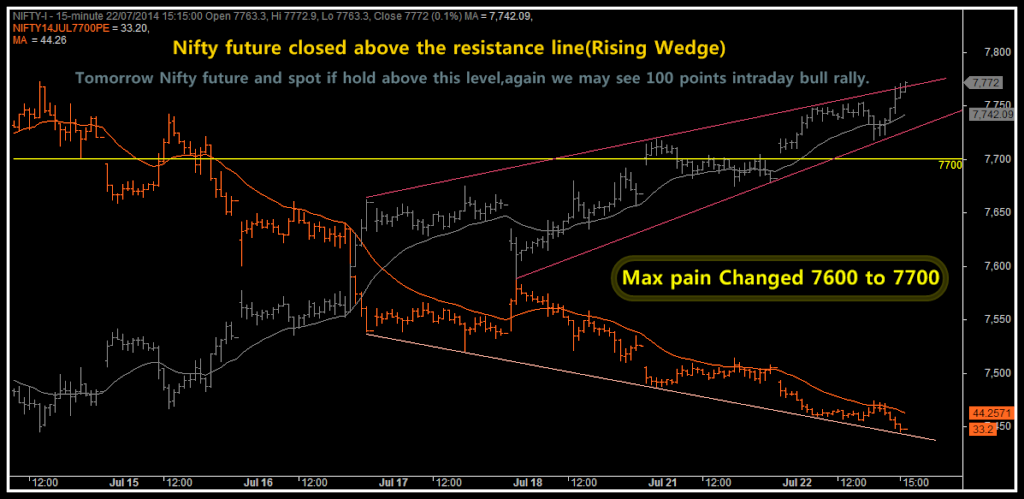
What is the “MaxPain Theory” in options?
This is again a theory based on the fact that option buyers are retail traders who typically always buy options whereas option writers/sellers are professional/institutions who have a higher chance of winning, and typically the professionals/institutions will have a higher chance of making profits.According to this theory the underlying (Nifty in the above example) on the expiry day will gravitate towards that point at which option buyers will feel the maximum pain, basically a point where the maximum number of options, both calls and puts value could become zero (worthless) on the expiry day. To calculate this we need the open interest of both calls and puts for various strike prices(Nifty in this example) and use a correct formula to calculate the MaxPain point.
Though the theory sounds like a conspiracy, if you look historically maxpain has proved to be a leading indicator predicting a fall/rise in the markets provided you have considered only the relevant strike prices.
Once you have a formula to calculate Maxpain there are 3 ways in which you can use it for trading, assume Nifty is presently 7770 and Maxpain is showing 7700.
a. You can setup strategies assuming that Nifty will go towards 7700.
b. You can use this for position management, which means that if Nifty is below the Maxpain, take larger buy positions than short positions, because we are generally expecting Nifty to go up. Similarly if Nifty is above the Maxpain, take bigger short positions than long ones as you expect the market to come lower towards the Maxpain.
c. Keep tracking Maxpain and anytime there is a big move, either up or down, use it as a buy or sell signal respectively.
|
|
| Back to top |
|
|
ap210585
White Belt

Joined: 27 Feb 2014
Posts: 38
|
| Post: #279 Posted: Tue Jul 22, 2014 6:58 pm Post subject: |
|
|
Hi Welgro,
Can you explain as to why Implied Vols for Calls between 7700 to 8000 have fallen so low. What does this suggest ? |
|
| Back to top |
|
|
welgro
Brown Belt
Joined: 24 Sep 2012
Posts: 1784
|
| Post: #280 Posted: Tue Jul 22, 2014 8:58 pm Post subject: |
|
|

 |
|
| Back to top |
|
|
anand512
White Belt
Joined: 26 Jun 2009
Posts: 109
|
| Post: #281 Posted: Tue Jul 22, 2014 9:17 pm Post subject: |
|
|
How to derive max pain value
From where we can get SMR ? |
|
| Back to top |
|
|
welgro
Brown Belt
Joined: 24 Sep 2012
Posts: 1784
|
| Post: #282 Posted: Tue Jul 22, 2014 10:08 pm Post subject: |
|
|
| ap210585 wrote: | Hi Welgro,
Can you explain as to why Implied Vols for Calls between 7700 to 8000 have fallen so low. What does this suggest ? |
When IV is relatively low and is expected to rise, buy options
(i.e. consider options strategies to take advantage of the expected move that allow us to be an option buyer)
When IV is relatively high and is expected to drop, sell options.
(i.e. consider options strategies to take advantage of the expected move that allow us to be an option seller) |
|
| Back to top |
|
|
welgro
Brown Belt
Joined: 24 Sep 2012
Posts: 1784
|
|
| Back to top |
|
|
welgro
Brown Belt
Joined: 24 Sep 2012
Posts: 1784
|
| Post: #284 Posted: Wed Jul 23, 2014 7:57 am Post subject: |
|
|
August 2014 OI data :-
 |
|
| Back to top |
|
|
welgro
Brown Belt
Joined: 24 Sep 2012
Posts: 1784
|
| Post: #285 Posted: Wed Jul 23, 2014 9:05 am Post subject: |
|
|
 |
|
| Back to top |
|
|
|


