| View previous topic :: View next topic |
| Author |
Nifty and other charts |
jaimaalaxmi
White Belt

Joined: 19 Jan 2012
Posts: 7
|
Post: #1  Posted: Wed Jun 05, 2013 11:15 am Post subject: Nifty and other charts Posted: Wed Jun 05, 2013 11:15 am Post subject: Nifty and other charts |
 |
|
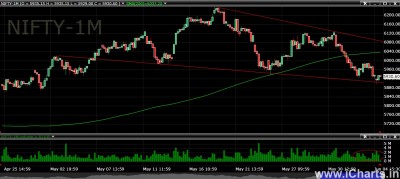
PFA the attached chart of Nifty. Please provide your comments
| Description: |
|
| Filesize: |
180.48 KB |
| Viewed: |
746 Time(s) |
|
|
|
| Back to top |
|
 |
|
| |
pkholla
Black Belt

Joined: 04 Nov 2010
Posts: 2890
|
| Post: #2 Posted: Mon May 11, 2015 11:00 am Post subject: Difference in chart and statistics data |
|
|
IC Admin: This post is NOT a criticism of ICharts or their data provider.
But I am just curious to know why?
Many times we see that a share is surging upwards and last candle shows high (for the candle and day) of lets say ICICI = 324.90 but data alongside shows high for the day as ICICI = 325.00
Or other way around, let us say day's lo in IC intra chart is Syndibank = 102.40 whereas the low in statistics is 102.35
This is NOT a one-off observation but seen daily in many scrips. Why is there such a discrepancy? Not all deals are reported to the public? (bulk, FII, DII, HNI)?
Prakash Holla
|
|
| Back to top |
|
|
kamal.icharts
Site Admin
Joined: 10 Apr 2013
Posts: 576
|
| Post: #3 Posted: Mon May 11, 2015 12:43 pm Post subject: Re: Difference in chart and statistics data |
|
|
Dear Member,
Please refer this link http://www.icharts.in/faqs/icharts-faq/intraday-open-high-low-does-not-match-with-odin-terminal-data.html
Regards
Kamal
| pkholla wrote: | IC Admin: This post is NOT a criticism of ICharts or their data provider.
But I am just curious to know why?
Many times we see that a share is surging upwards and last candle shows high (for the candle and day) of lets say ICICI = 324.90 but data alongside shows high for the day as ICICI = 325.00
Or other way around, let us say day's lo in IC intra chart is Syndibank = 102.40 whereas the low in statistics is 102.35
This is NOT a one-off observation but seen daily in many scrips. Why is there such a discrepancy? Not all deals are reported to the public? (bulk, FII, DII, HNI)?
Prakash Holla |
|
|
| Back to top |
|
|
pkholla
Black Belt
Joined: 04 Nov 2010
Posts: 2890
|
| Post: #4 Posted: Mon May 11, 2015 1:32 pm Post subject: Discrepancy |
|
|
Kamal: Thank you
Prakash Holla
|
|
| Back to top |
|
|
|
|
You cannot post new topics in this forum
You cannot reply to topics in this forum
You cannot edit your posts in this forum
You cannot delete your posts in this forum
You cannot vote in polls in this forum
You can attach files in this forum
You can download files in this forum
|
Powered by phpBB © 2001, 2005 phpBB Group
|
|


