| View previous topic :: View next topic |
| Author |
NIFTY CHART WITH DMI AND RSI INDICATORS |
rrk2006hyd
Yellow Belt

Joined: 13 Oct 2010
Posts: 874
|
Post: #1  Posted: Thu May 05, 2011 3:36 pm Post subject: NIFTY CHART WITH DMI AND RSI INDICATORS Posted: Thu May 05, 2011 3:36 pm Post subject: NIFTY CHART WITH DMI AND RSI INDICATORS |
 |
|
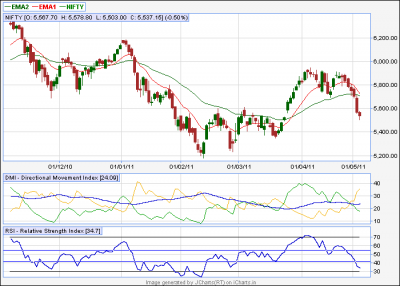
Dear friends i'm posting Nifty daily chart using
EMA 13, EMA39
DMI(13,39),
RSI(13,30,70)
comments are welcome.
| Description: |
|
| Filesize: |
15.37 KB |
| Viewed: |
733 Time(s) |
|
|
|
| Back to top |
|
 |
|
| |
veerappan
Expert

Joined: 19 Dec 2007
Posts: 3680
|
| Post: #2 Posted: Thu May 05, 2011 3:43 pm Post subject: |
|
|
| nothing much dear 4888 possible
|
|
| Back to top |
|
|
vinst
Black Belt

Joined: 09 Jan 2007
Posts: 3303
|
| Post: #3 Posted: Fri May 06, 2011 9:14 am Post subject: Re: NIFTY CHART WITH DMI AND RSI INDICATORS |
|
|
| rrk2006hyd wrote: | Dear friends i'm posting Nifty daily chart using
EMA 13, EMA39
DMI(13,39),
RSI(13,30,70)
comments are welcome. |
rrk,
Thanks for the chart.
The DMI is 13 period and the final smoothing to adx is 39 period?
regards
|
|
| Back to top |
|
|
rrk2006hyd
Yellow Belt
Joined: 13 Oct 2010
Posts: 874
|
| Post: #4 Posted: Fri May 06, 2011 10:42 am Post subject: |
|
|
| yes sir..it is showing good signals with DMI..13,39
|
|
| Back to top |
|
|
vinst
Black Belt
Joined: 09 Jan 2007
Posts: 3303
|
| Post: #5 Posted: Fri May 06, 2011 11:26 am Post subject: |
|
|
| rrk2006hyd wrote: | | yes sir..it is showing good signals with DMI..13,39 |
surprisingly 39 period smoothing for ADX is showing fast response. This is not expected from 39 period moving average.
|
|
| Back to top |
|
|
rrk2006hyd
Yellow Belt
Joined: 13 Oct 2010
Posts: 874
|
| Post: #6 Posted: Fri May 06, 2011 11:37 am Post subject: nifty lievel with Fibonacci |
|
|
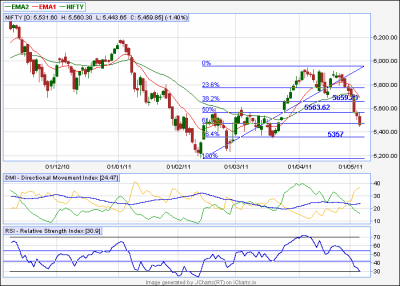
nifty levels with fibanocci..let us see
| Description: |
|
| Filesize: |
17.03 KB |
| Viewed: |
632 Time(s) |
|
|
|
| Back to top |
|
|
|
|
You cannot post new topics in this forum
You cannot reply to topics in this forum
You cannot edit your posts in this forum
You cannot delete your posts in this forum
You cannot vote in polls in this forum
You can attach files in this forum
You can download files in this forum
|
Powered by phpBB © 2001, 2005 phpBB Group
|
|


