| View previous topic :: View next topic |
| Author |
nifty for 17/01/2012 |
ajeya12
White Belt

Joined: 30 Oct 2011
Posts: 132
|
Post: #1  Posted: Mon Jan 16, 2012 8:48 pm Post subject: nifty for 17/01/2012 Posted: Mon Jan 16, 2012 8:48 pm Post subject: nifty for 17/01/2012 |
 |
|
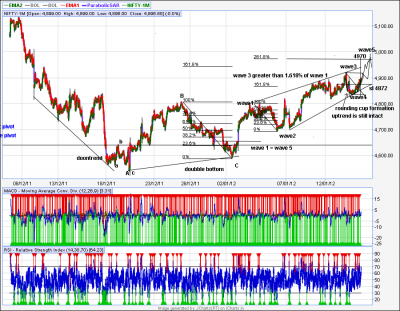
nifty for tmrw 4970 ..with sl 4870.below 4840 bears conquer.
| Description: |
| According to elliottwave theory |
|
| Filesize: |
87.28 KB |
| Viewed: |
679 Time(s) |

|
|
|
| Back to top |
|
 |
|
|
 |
vinay28
Black Belt

Joined: 24 Dec 2010
Posts: 11748
|
Post: #2  Posted: Mon Jan 16, 2012 9:02 pm Post subject: Posted: Mon Jan 16, 2012 9:02 pm Post subject: |
 |
|
| ajeya, you don't seem to see the sense in posting all your calls in one thread. you are creating more than one a day. too many threads are creating confusion.
|
|
| Back to top |
|
 |
pkholla
Black Belt

Joined: 04 Nov 2010
Posts: 2890
|
Post: #3  Posted: Mon Jan 16, 2012 9:41 pm Post subject: Posted: Mon Jan 16, 2012 9:41 pm Post subject: |
 |
|
ajeya12: vinay is right. Why dont you start just one thread, say, "ajeya a to z" and post in that? Your posts are good, we can cross check from one to other post (of yours) quickly without wasting time
Regards, Prakash Holla
|
|
| Back to top |
|
 |
kishjk7551
White Belt

Joined: 26 Jan 2008
Posts: 293
|
Post: #4  Posted: Tue Jan 17, 2012 10:41 am Post subject: Posted: Tue Jan 17, 2012 10:41 am Post subject: |
 |
|
Ajeya nifty tgt 4970 tgt almost achieved .... wow
Regards
Jayant
|
|
| Back to top |
|
 |
ajeya12
White Belt

Joined: 30 Oct 2011
Posts: 132
|
Post: #5  Posted: Tue Jan 17, 2012 8:46 pm Post subject: scripts for 18/01/2012 -- TCS and TATAMOTORS Posted: Tue Jan 17, 2012 8:46 pm Post subject: scripts for 18/01/2012 -- TCS and TATAMOTORS |
 |
|
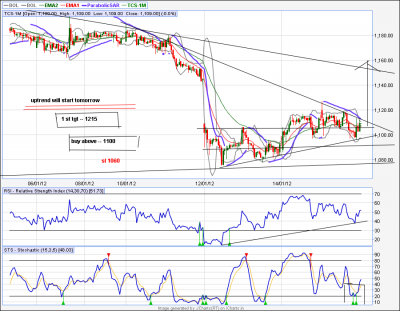
TCS break above 1100 to reach the tgts 1160, if sustains 1160, 1200,1215,then fly to higher tgts 
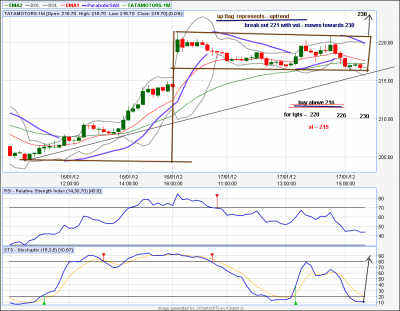
TATA MOTORS flag pattern represents uptrend.break above 220 with vol reaches the tgt of 230 
| Description: |
|
| Filesize: |
96.24 KB |
| Viewed: |
433 Time(s) |

|
| Description: |
|
| Filesize: |
69.14 KB |
| Viewed: |
437 Time(s) |

|
|
|
| Back to top |
|
 |
ajeya12
White Belt

Joined: 30 Oct 2011
Posts: 132
|
|
| Back to top |
|
 |
vinay28
Black Belt

Joined: 24 Dec 2010
Posts: 11748
|
Post: #7  Posted: Tue Jan 17, 2012 9:26 pm Post subject: Posted: Tue Jan 17, 2012 9:26 pm Post subject: |
 |
|
| ajeya, upto what lower level of nifty is the handle and hence this theory considered valid?
|
|
| Back to top |
|
 |
ajeya12
White Belt

Joined: 30 Oct 2011
Posts: 132
|
Post: #8  Posted: Wed Jan 18, 2012 8:02 am Post subject: nifty--5050 Posted: Wed Jan 18, 2012 8:02 am Post subject: nifty--5050 |
 |
|
| vinay28 wrote: | | ajeya, upto what lower level of nifty is the handle and hence this theory considered valid? |
Vinay28 Hi,this is the price patterns.I ALWAYS FOLLOW THE TREND AND PATTERNS.cup n handle formation indicates bullish.the lenth of the cup up to the handle is the tgt above.my sl is 4965.lets see.tgt--5050.
|
|
| Back to top |
|
 |
vinay28
Black Belt

Joined: 24 Dec 2010
Posts: 11748
|
Post: #9  Posted: Wed Jan 18, 2012 8:26 am Post subject: Posted: Wed Jan 18, 2012 8:26 am Post subject: |
 |
|
| in other words, if your sl is 4965, does it mean cup & handle fails below 4965?
|
|
| Back to top |
|
 |
ajeya12
White Belt

Joined: 30 Oct 2011
Posts: 132
|
Post: #10  Posted: Wed Jan 18, 2012 9:44 am Post subject: Posted: Wed Jan 18, 2012 9:44 am Post subject: |
 |
|
| vinay28 wrote: | | in other words, if your sl is 4965, does it mean cup & handle fails below 4965? |
it will take support near 4960 and bounce to 5050 this is my view lets see.my intra sl changed to 4940
|
|
| Back to top |
|
 |
ajeya12
White Belt

Joined: 30 Oct 2011
Posts: 132
|
Post: #11  Posted: Thu Jan 19, 2012 10:42 am Post subject: Posted: Thu Jan 19, 2012 10:42 am Post subject: |
 |
|
| kishjk7551 wrote: | Ajeya nifty tgt 4970 tgt almost achieved .... wow
Regards
Jayant |
THANK U JAYANT 
|
|
| Back to top |
|
 |
ajeya12
White Belt

Joined: 30 Oct 2011
Posts: 132
|
|
| Back to top |
|
 |
opportunist
White Belt

Joined: 27 Apr 2010
Posts: 356
|
Post: #13  Posted: Thu Jan 19, 2012 11:04 am Post subject: Re: easy to track the sl and tgt Posted: Thu Jan 19, 2012 11:04 am Post subject: Re: easy to track the sl and tgt |
 |
|
| ajeya12 wrote: | try to draw trend lines ,and watch the magic  |
You are trying to draw what is also known as gann channels. Pls make the lines straight and remove unwanted lines. Kaafi confusing lag raha hai.
Oppo
|
|
| Back to top |
|
 |
ajeya12
White Belt

Joined: 30 Oct 2011
Posts: 132
|
Post: #14  Posted: Thu Jan 19, 2012 6:16 pm Post subject: Re: easy to track the sl and tgt Posted: Thu Jan 19, 2012 6:16 pm Post subject: Re: easy to track the sl and tgt |
 |
|
| opportunist wrote: | | ajeya12 wrote: | try to draw trend lines ,and watch the magic  |
You are trying to draw what is also known as gann channels. Pls make the lines straight and remove unwanted lines. Kaafi confusing lag raha hai.
Oppo |
hi oppo
i have simply drawn the trend lines not the gann angles.. its for onlly my study.i was showing the breakout point on the upwards.the break out occurs within the lines. 
|
|
| Back to top |
|
 |
ajeya12
White Belt

Joined: 30 Oct 2011
Posts: 132
|
|
| Back to top |
|
 |
|

